Inequality
MDGs and SDGs
- SDG 10. Reduce inequality (in general, not only gender as with the MDGs even though there is a separate objective for that in the SDGs) within and among countries. Targets:
- 10.1 By 2030, progressively achieve and sustain income growth of the bottom 40 per cent of the population at a rate higher than the national average.
- 10.3 Ensure equal opportunity and reduce inequalities of outcome, including by eliminating discriminatory laws, policies and practices and promoting appropriate legislation, policies and action in this regard.
- 10.4 Adopt policies, especially fiscal, wage and social protection policies, and progressively achieve greater equality.
- Perhaps the same that can fight against poverty.
- 10.6 Ensure enhanced representation and voice for developing countries in decision-making in global international economic and financial institutions in order to deliver more effective, credible, accountable and legitimate institutions.
- Non-discrimination politically and legally.
- Also between countries, in institutions like the UN this isn’t the case→some have greater decision power.
- Non-discrimination politically and legally.
- Means (of implementation) :
- 10.a Implement the principle of special and differential treatment for developing countries, in particular least developed countries, in accordance with World Trade Organisation agreements.
- 10.b Encourage official development assistance and financial flows, including foreign direct investment, to States where the need is greatest, in particular least developed countries, African countries, small island developing States and landlocked developing countries, in accordance with their national plans and programmes.
- 10.c By 2030, reduce to less than 3 per cent the transaction costs of migrant remittances and eliminate remittance corridors with costs higher than 5 per cent.
- Because the money is sent from abroad, remittances bring foreign currency (foreign exchange) into the receiving country. This increases the country’s external financial inflows, similar to exports, foreign aid, or foreign investment. Transfers from the richest to the poorest.
Income-based
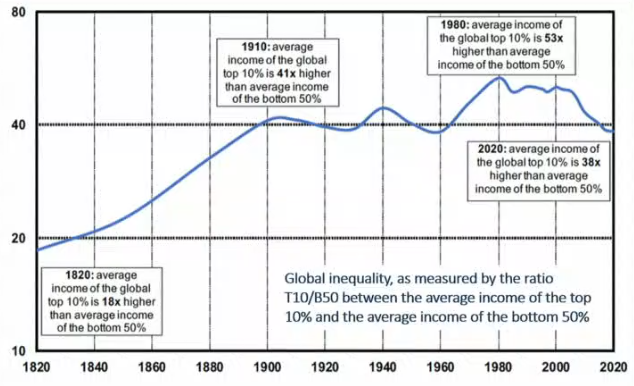 Info stopped in 2020 when going a bit downwards but massively high. Difference of 40x in 2020 and 53x at the max!
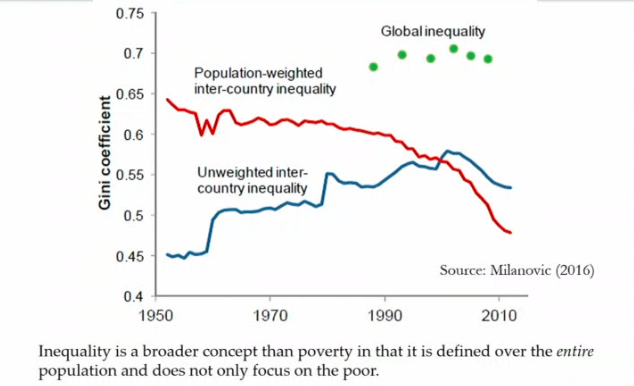 For the green dots (not a line, doing everyone every time is too hard) we do everyone together, the world is a country. Without any country reference poverty is higher. PPP is taken into account here, but border effects still affect and explain this difference.
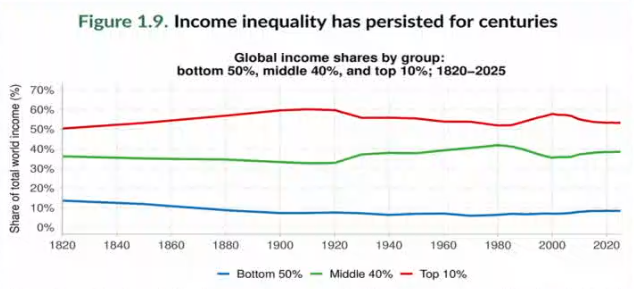
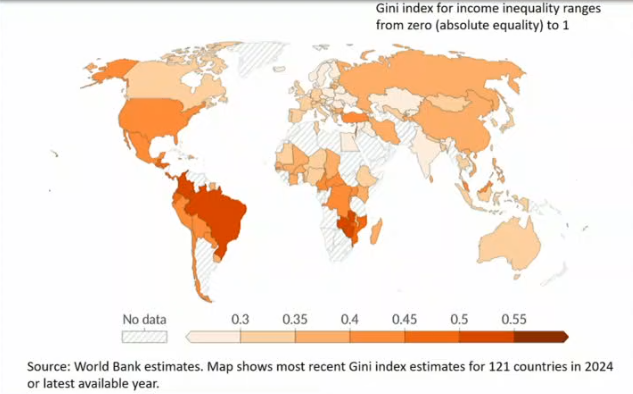
- Global inequality (Gini coefficient) ranges from 0.55 to 0.70 depending on the measure used.
- More difficult to communicate than ratios between income share groups.
- The high level of global inequality reflects sizeable per capita income disparities across countries, which account for around three quarters of global inequality (Milanovic 2013).
- Some measures of global inequality exhibit a declining trend in the last few decades in response to rising incomes for those living in China and India, where hundreds of millions of people have been lifted out of poverty.
- However, other measures of global income inequality— adjusted for top incomes which tend to be underreported in most household surveys—appear to be broadly stable since the early 1990s.
- Explains different betwen global and inter-country despite PPP adjustment.
- What to use? Weighted or not? Individual information would be best but perhaps then we would just be capturing the effects redistribution policies often present in rich countries as each individual is subject to different ones. Rich countries don’t always have them, but poor ones usually dont.
- Comparing the top 10% to the bottom 50%, so basically measures that do ratios between income shares in a country or between some, don’t reflect the whole distribution of income either.
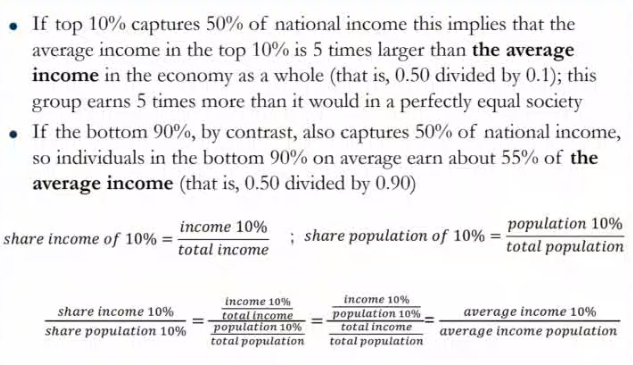
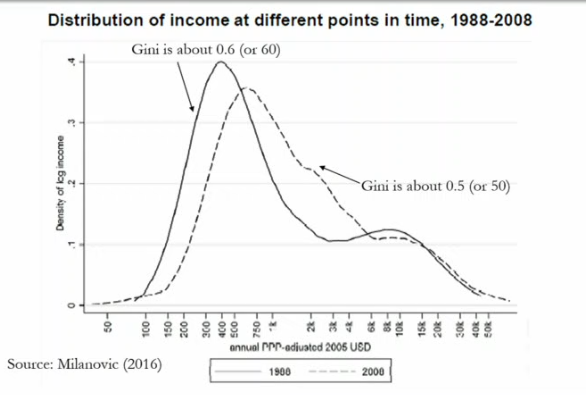 Unclear at first without a specific measure if inequality has risen or not in this specific country. A larger share of the population earns the average income basically, which allows to conclude that there is less inequality. Gini is useful as a measure, confirms this.
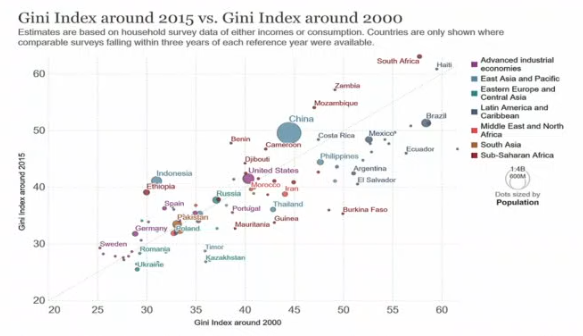 The MDGs changed things for the better on inequality.
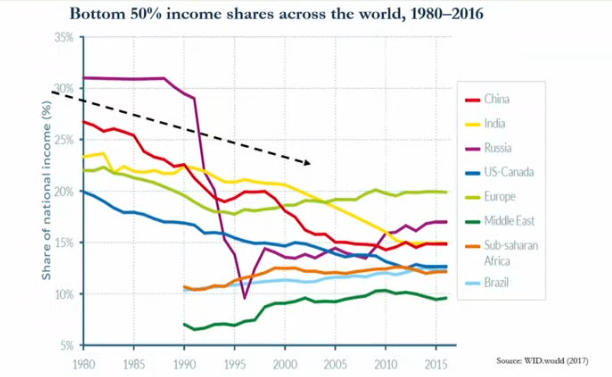
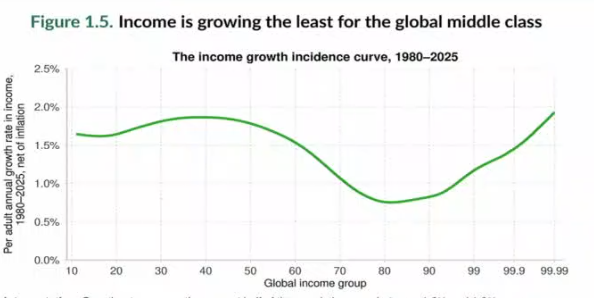 Self-explanatory. Income of the poorest incomes faster so we can expect a convergence, although this tendency can take a lot of time to complete. But lower-middle class grows slower. The richest ones are those who gain the most in terms of income growth. If there is an interest in reducing inequality this bimodelisation of the distribution should be targeted to be reverted.
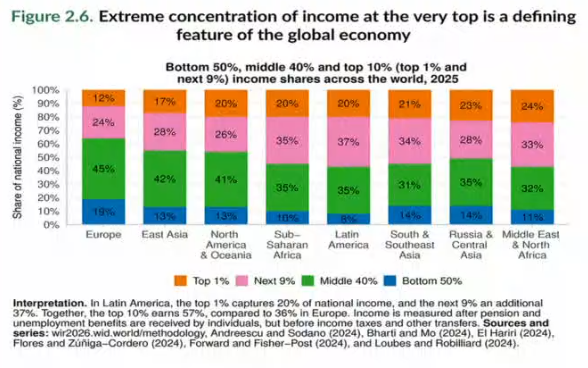
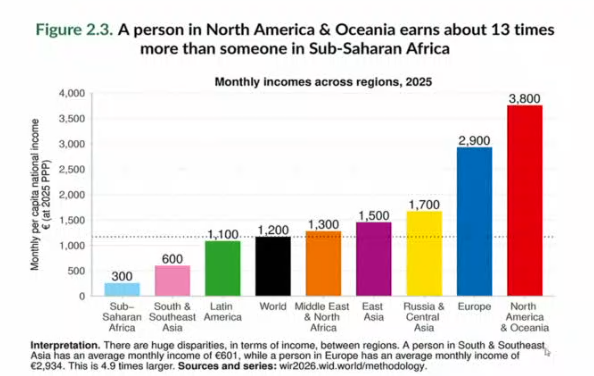 Also a lot of inequality between regions in income terms.
- Comparing the top 10% to the bottom 50%, so basically measures that do ratios between income shares in a country or between some, don’t reflect the whole distribution of income either.
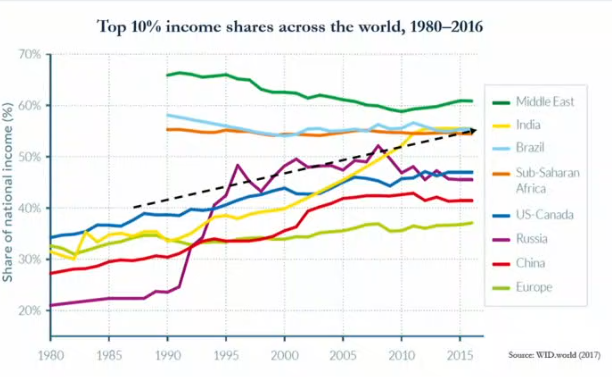
Evolution summarised globally
- Measures of inequality based on Gini coefficients of gross and net incomes have increased substantially since 1990 in most of the developed world.
- Inequality, on average, has remained stable in DVGs, albeit at a much higher level than that observed in advanced economies.
- However, there are large disparities across DVGs, with Asia and Eastern Europe experiencing marked increases in inequality, and countries in Latin America exhibiting notable declines (although the region remains the most unequal in the world).
Wealth-based
- Income versus wealth:
- Income: value individuals read on their pay checks (pre-income tax) versus after all income, wealth and consumption taxes are deducted, and after all non-replacement transfers (e.g. healthcare, disability and housing benefits) are added (post-tax income).
- Household wealth is defined as the sum of financial assets (e.g. deposits, stocks, bonds, equity) and non-financial assets (e.g. housing, business), net of debts, possessed by individuals = measure of current and future economic gains (power). Intertemporally whereas income is immediate!
- Even if stocks may generate income in the future (dividens) they aren’t counted as income.
- Inequality is more extreme in wealth than income. In both advanced economies and DVGs, income Ginis, on average, are half the size of wealth Ginis.
- Almost systematic trend observable in most countries.
- In most countries with available data, the share held by the 1 percent wealthiest population is rising at the expense of the bottom 90 percent population.
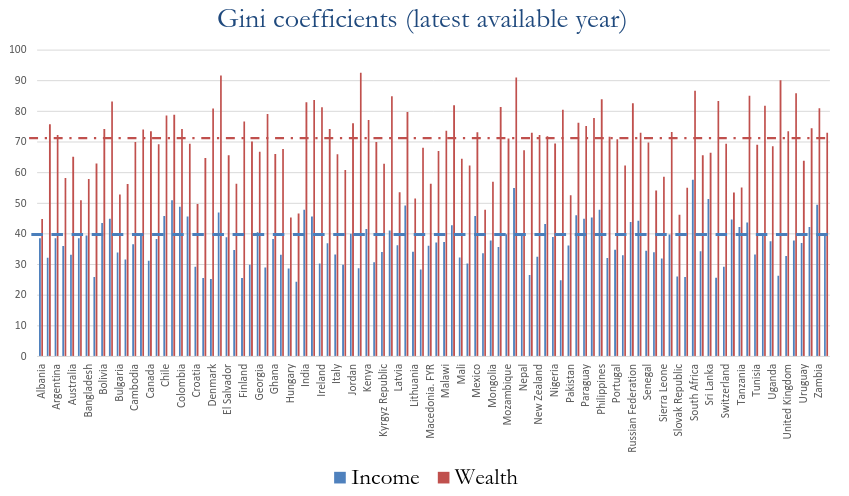 Average is 70 for wealth and 40 for income (%s of 1!). Not 100% up to date but these differences are still observed nowadays.
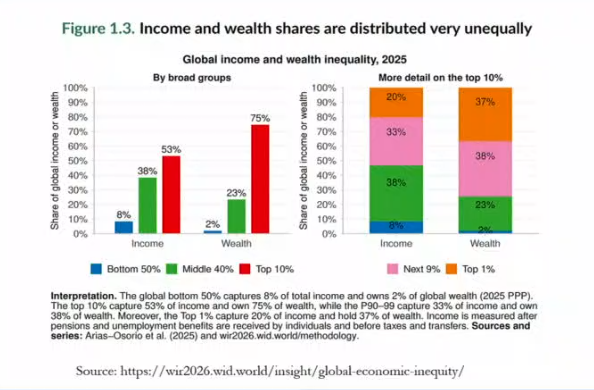 Considering wealth shows more inequality.
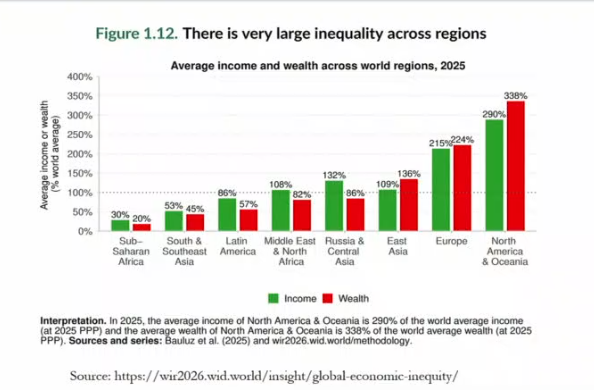 With respect to the world average, with some exceptions, inequality is greater in wealth.
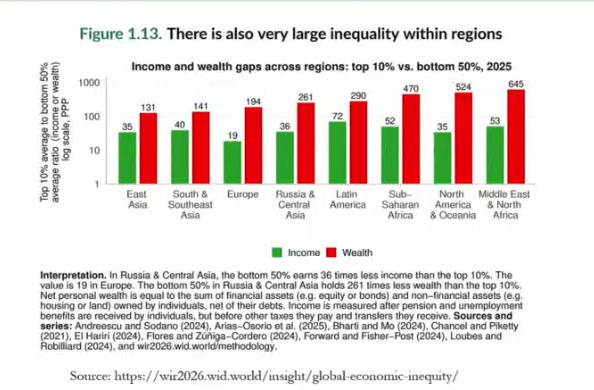 Inside regions wealth and income also show different inequality gaps.
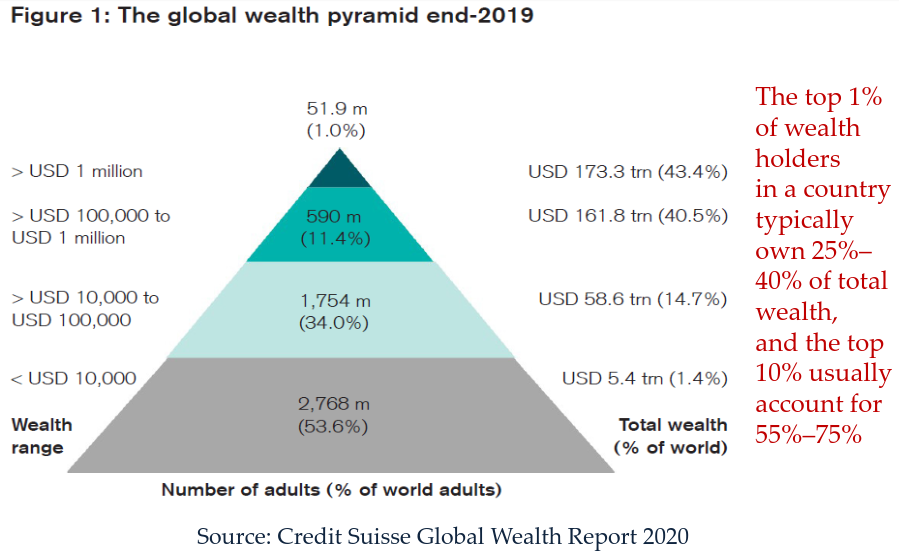
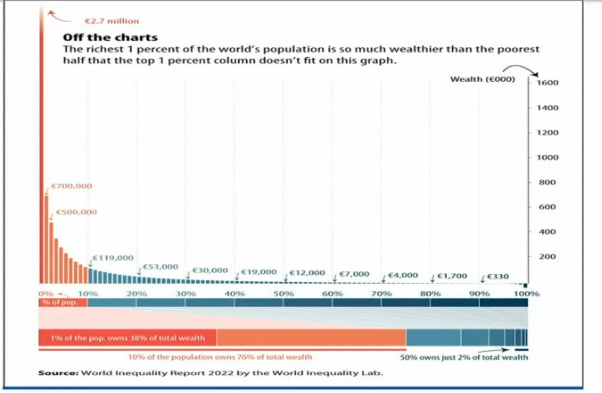
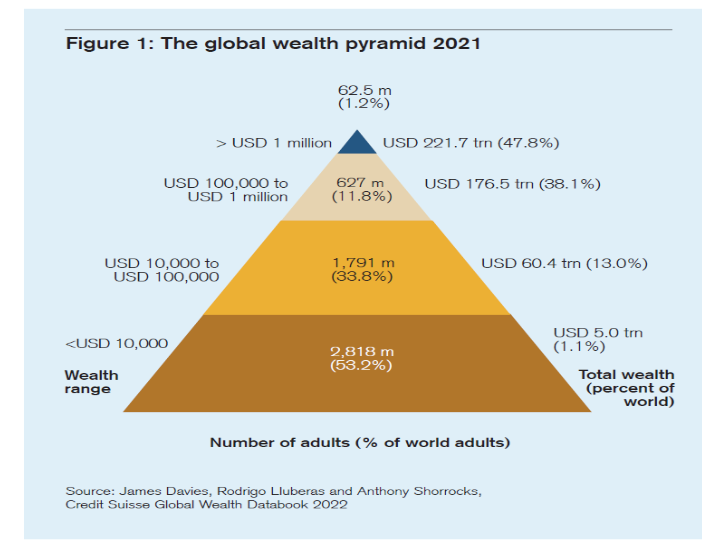 More inequality and more people with more than a million. The rich get richer but the others lose.
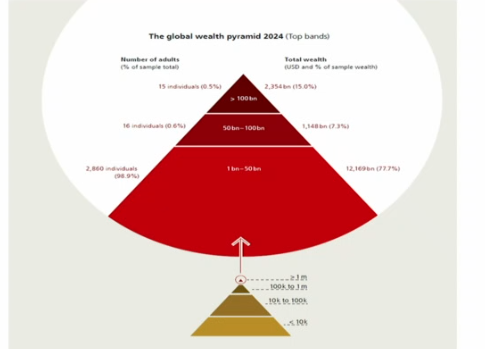 Here we decompose for the top, those that earn more than 1 billion. 3k people would own half of the global wealth.
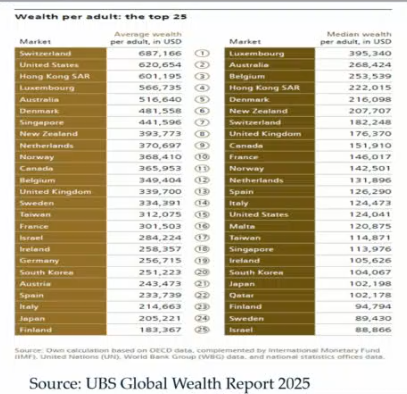 Average vs. median. In CH for example we earn more but there is a larger part of the population earning relatively more in Luxembourg in regards to average.
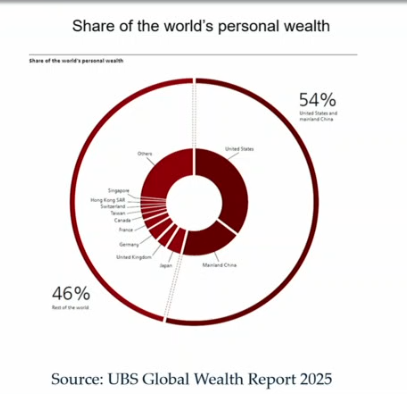 Half of global wealth goes to the US and mainland China.
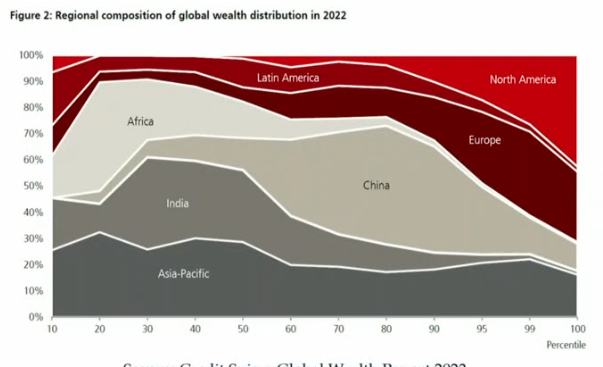 Extremely tiny share going to Africa, highest wealth fortunes going to NA, EUR and AP.
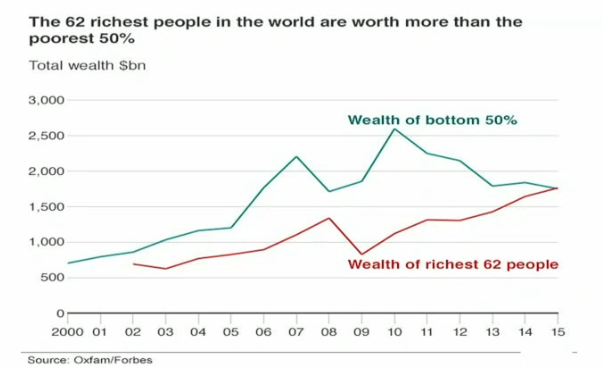
 Self-explanatory graphs. Wealth of richest 62 is increasing relative to bottom 50% btw.
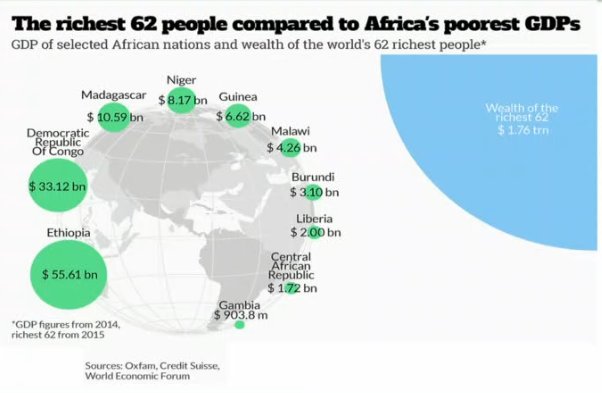 For comparison, some people are worth more than certain countries.
Measurement : intro
- Income inequality—the most widely cited measure of inequality of outcomes—is typically measured by the market gross (can include pension and unemployment benefits) or net (after tax and transfers from social insurance programs) Gini, and by tracking changes in the income shares of the population (for example, by decile/quintile).
- Net household wealth: sum of financial assets (e.g. equity or bonds) and non-financial assets (e.g. housing or land) owned by individuals, net of their debts.
- Inequality of opportunities is often measured by tracking health, education and human development outcomes by income group, or by examining access to basic services and opportunities.
Can be done in various ways basically.
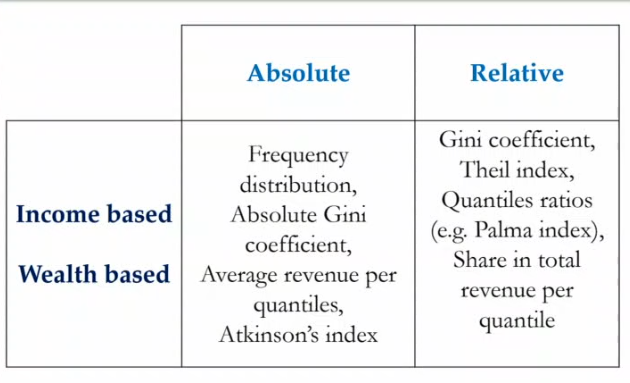 Relative ones go through normalisation or ratios, between average incomes and wealth groups f.ex. With absolute measures we see absolute differences of income or wealth between different categories. This can change conclusions quite a lot.
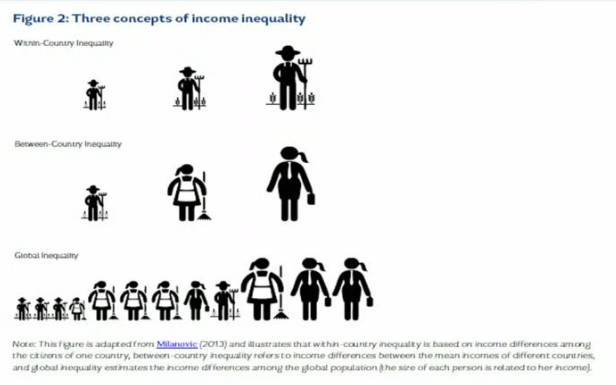
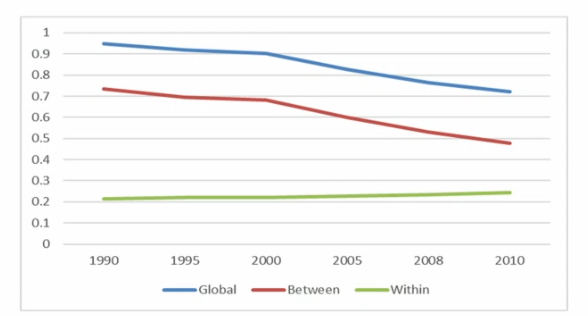
Within/between/global
Measurement: Data sources
World Bank: Poverty and Inequality Platform https://pip.worldbank.org/home
- Based on household surveys + net/gross income. UN-WIDER: World Income Inequality Database – WIID https://www.wider.unu.edu/project/world-income-inequality- database-wiid.
- Based on household surveys + net/gross income Funded by public and non-profit institutions: World Inequality Database: https://wid.world/
- Based on household surveys and national accounts + gross income.
- More systematic with more in-depth analysis of inequality and its dynamic with macroeconomic variables.
- It’s a collaboration between many entities like governments not necessarily controlled by an OI.
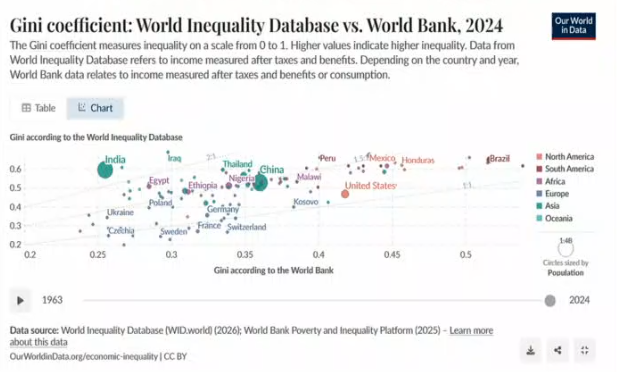
- More inequality in the WID and not the WB data because of method and specially the WID uses income after transfers and have more up-to-date estimates. There isn’t a better one, we just have to take into account differences and stick to one database for historical analyses so that we are actually doing things right and get a good policy direction.
Gini
- A popular measure of inequality is the Gini coefficient, which ranges from 0 (perfect equality) to 1 (perfect inequality) but is typically in the range of 0.3-0.5 for per capita expenditures.
- The Gini is derived from the Lorenz curve, which sorts the population from poorest to richest, and shows the cumulative proportion of the population on the horizontal axis and the cumulative proportion of expenditure (or income) on the vertical axis.
- While the Gini coefficient has many desirable properties – mean independence, population size independence, symmetry, and Pigou-Dalton Transfer sensitivity – it cannot easily be decomposed to show the sources of inequality.
- Can be used therefore to trace the impact of redistributive policies.
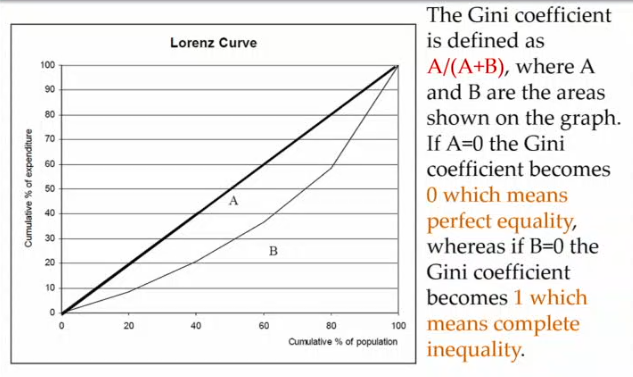 Individuals are ranked according to income or wealth from poorest to richest and in the curve we put the share of total income they represent. If everyone earns the same it wouldn’t matter, not like this is the case in reality.
Country Ginis
 Household services are not produced each year obviously… again.
International Ginis
- Unweighted inter-country inequality is calculated across GDPs obtained from household surveys of all countries in the world, without population-weighting.
- The population-weighted inter-country inequality takes into account population weights.
- Finally, the global inequality concept focuses on individuals, instead of countries. The calculation is based on household surveys with data on individual incomes or consumption.
Theil’s index
- There are a number of measures of inequality that satisfy criteria allowing for the decomposition of inequality into the part that is due to inequality within areas (e.g. urban, rural) and the part that is due to differences between areas (e.g. the rural- urban income gap).
- The most widely used are the Theil indexes Theil’s T and Theil’s L.
- In most cases at least three-quarters of inequality in a country is due to within-group inequality, and the remaining quarter to between-group differences.
- Can help see what’s behind inequality and its changes.
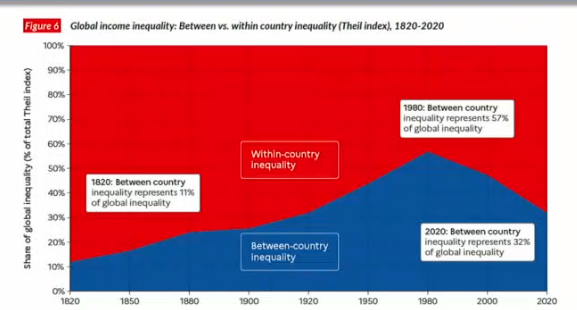 For the first time, in 1980 more or less, tendencies get reversed. There is a convergence between countries in GDP/capita. Less advanced countries have been able to catch up because of the reduction of energy prices and such energy dependency, can be one of the reasons. Also China and India catching up has a big effect.
Net vs. gross income
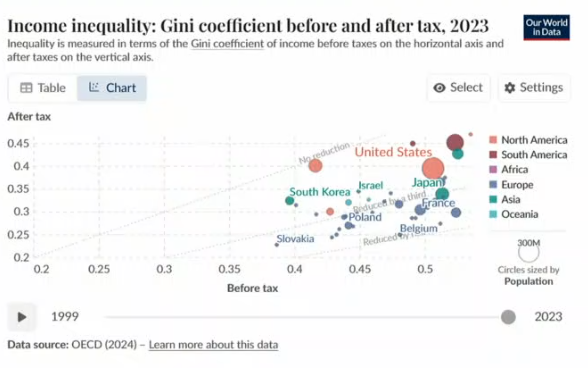 Smallest one for the USA, inefficient or weak transfer programs could be represented here or a mix of the two, France and Belgium among the biggest in terms of the impact of this effect.
Limitations
- One problem with measuring income inequality with the Theil index or Gini coefficient, or with relative income per capita growth between poor and rich individuals/countries is that it summarises changes in the entire income distribution into one number.
- For example, a decline in income inequality can be perfectly consistent with poor individuals becoming poorer if there is more equality between high and middle-income individuals.
- Or, a country may experience both a Gini-reducing decrease in poverty and a rise in the share of income going to the top 10%, which increases the Gini; if these effects offset each other, the overall Gini can remain constant, creating the impression that the distribution of income is not changing—while in fact the middle class is being squeezed out.
- Transfer policy assessment or policy assessment in general can be impacted by this. Niches can be created for the rich, the poorest, etc.
- The value of the Gini index is not necessarily easy to interpret: above which value inequality can be seen as non-acceptable? →Moral judgement
- It’s like GDP/capita which doesn’t give distribution info, here we get closer but this is far from perfect.
Other indicators
An alternative way of looking at this is to explore changes along the entire income distribution:
- Average income/wealth per quantile group.
- Growth rates per quantile groups.
- Indicator 10.1.1 of the SDGs: Growth rates of household expenditure or income per capita among the bottom 40 per cent of the population and the total population.
- Share of national income captured by each quantile group.
- Quantiles ratio
- The Palma ratio focuses on the differences between those in the top and bottom income brackets: the ratio takes the richest 10% of the population’s share of gross national income (GNI) and divides it by the poorest 40% of the population’s share.
- The simplest measurement of inequality sorts the population from poorest to richest and shows the percentage of expenditure (or income) attributable to each fifth (quintile) or tenth (decile) of the population.
- The poorest quintile typically accounts for 6-10% of all expenditure, the top quintile for 35-50%.
- Decile dispersion ratio: ratio of the average income of the richest 10 percent of the population divided by the average income of the bottom 10 percent.