Poverty
MDGs and SDGs
MDG Goal 1: Eradicate extreme poverty and hunger.
- Target 1.A: Halve, between 1990 and 2015, the proportion of people whose income is less than one dollar a day.
- Indicator 1.1—Proportion of population living below $1.25 (PPP) a day.
- Inconsistency? Not really.
- Inconsistency? Not really.
SDG 1. End poverty in all its forms everywhere.
- 1.1 By 2030, eradicate extreme poverty for all people everywhere, currently measured as people living on less than $1.25 a day.
- 1.2 By 2030, reduce at least by half the proportion of men, women and children of all ages living in poverty in all its dimensions according to national definitions.
- Not only income.
Evolution of people living in poverty (income)
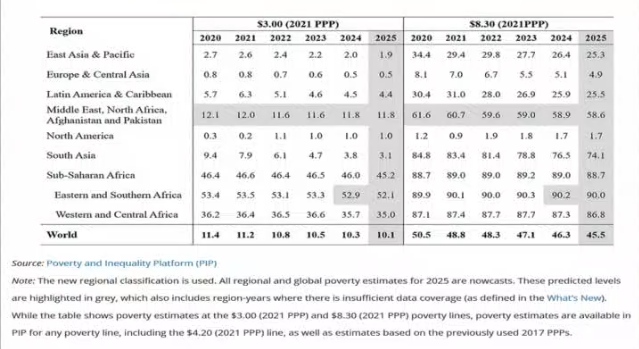
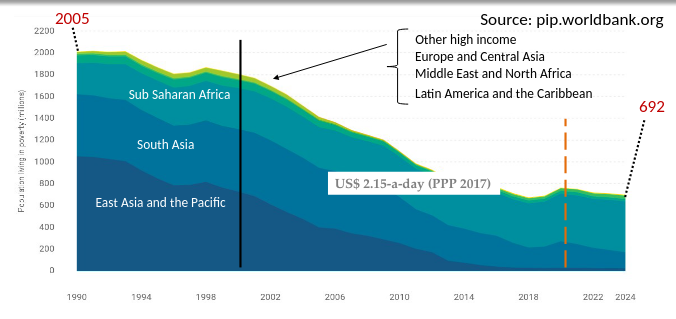 Substantial reductions in poverty in East Asia and the Pacific and South Asia (rapid growth and development of China and India has helped lift millions of people out of poverty). PPP as computed in 2021 is indicated, not done in an annual basis as it requires purchasing power index for many countries. In 2026, the reference is 2021 and the threshold (ITS 3$ PER DAY, TYPO) used is from last year.
Everytime PPP changes we recompute.
 More poor individuals in Africa.
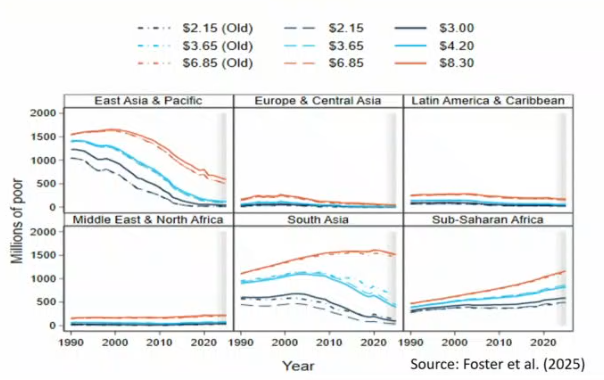
Different thresholds
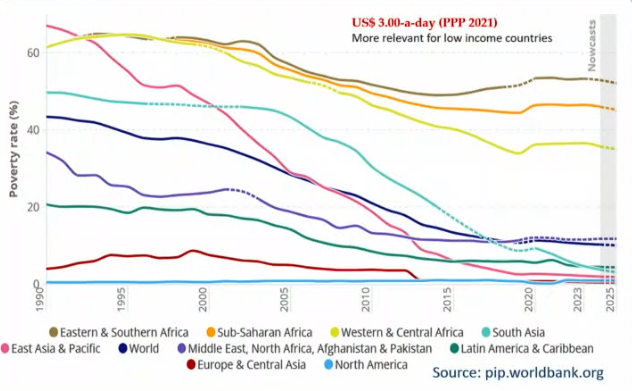
Depending on what threshold you take things can change a lot. The higher the threshold the more poor people appear on the graph. Why have different ones? They are calculated using data from different countries, e.g. 3$xday is more relevant for low-income countries as they were used to calculate this threshold. This allows to consistently identify poverty in certain types of countries. We can’t apply anything to anyone.
 Here we can see the differences between thresholds. Using the wrong one, as we can see, can lead us to extrapolate false conclusions.
Covid impact
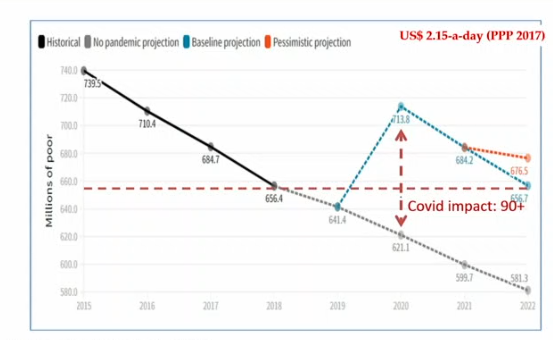 The poverty line changed relative to it’s expected trajectory. If we had no additional global shocks (in this case climate change) the recovery would have been even better (blue line). Either way it’s a projection from 2021/2.
Measurement
Poverty lines
- Individuals/households are poor when their expenditure (or income) falls below a poverty line.
- Poverty lines can be based on three methods: the cost of basic needs, food energy intake, and subjective evaluations.
- While the first two methods best apply to absolute poverty lines, the last method best applies to relative poverty lines.
Cost of basic needs
- Most commonly used is the cost of basic needs approach.
- It first estimates the cost of acquiring enough food for adequate nutrition – usually 2,100 Calories per person per day – and then adds on the cost of other essentials such as clothing and shelter.
- The method proceeds as follows: a) stipulate a consumption bundle that is deemed to be adequate, with both food and non-food components; and b)estimate the cost of the bundle for each subgroup (urban/rural, each region, etc.).
- The basic needs approach requires information on the prices of the goods that the poor consume.
- When price information is lacking, which might be the case in rural areas, one may use the food energy intake method, which graphs expenditure (or income) per capita against food consumption (in Calories per person per day).
- From this, one may determine the expenditure (or income) level at which a household acquires enough food.
Subjective method
- Subjective poverty lines are based on asking people what minimum income level is needed in order to just make ends meet.
- More about perception, not observation of the interviewer.
- These approaches are complementary.
Absolute lines
- An absolute poverty line is useful in tracking the evolution of poverty over time and is also useful when evaluating the effects of policies and programs on the incidence of poverty.
- Poverty lines can be revised from time to time: intertemporal comparison is only possible if the same poverty line is used to compute poverty rates in different years.
- There are national and international poverty lines.
- International poverty lines (the World Bank) are based on national ones.
- These have their limitations because the definitions might not be the same across countries, but these are useful for stuff like SDGs when we wanna monitor evolution of poverty globally.
CPI
- World Bank estimates of global absolute poverty rely on many different data sources. Main ones are, household surveys, consumer price indices (CPIs), purchasing power parities.
- Household information cannot be collected every year in many countries especially the least advanced ones. Nominal values are updated using CPI information to reflect changes in purchasing power due to changes in domestic prices: current versus constant values.
- Purchasing power parities (PPPs) are used to ensure that the global poverty line reflects the same real standard of living across countries. PPP indices act like purchasing power based exchange rates.
Calculating PPP
- PPP computation:
- If the price of a hamburger is €4.80 in France and 0.83 to the €1.00 from France’s perspective (4.00/4.80) and €1.20 to the dollar from the United States’ perspective (4.80/4.00).
- Thus, for every €1.00 spent on hamburgers in France, $0.83 would have to be spent in the United States to obtain the same quantity and quality—that is, the same volume—of hamburgers.
- PPPs are calculated in stages: first for item groups, then for various aggregates, and finally for GDP.
- Therefore, if the PPP for GDP between France and the United States is €0.95 to 1.00 spent on GDP in the United States, €0.95 would have to be spent in France to purchase the same volume of goods and services.
Importance
- Assume the nominal exchange rate is 1 USD = 1 EUR.
- In the US, 1000 USD buy 250 hamburgers.
- In France, 1000 USD equivalent to 1000 EUR at the nominal rate buy only 208 hamburgers (1000 / 4.80 EUR).
- Nominal exchange rates do not necessarily account for differences in the actual purchasing power of currencies.
- In this example, using the nominal rate overestimates the purchasing power of consumers in France compared to their counterparts in the US for the same basket of goods.
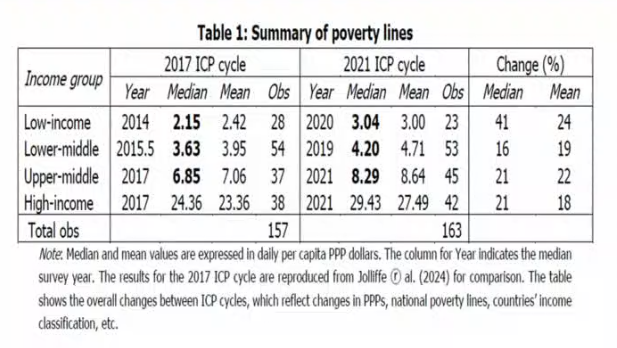
Results
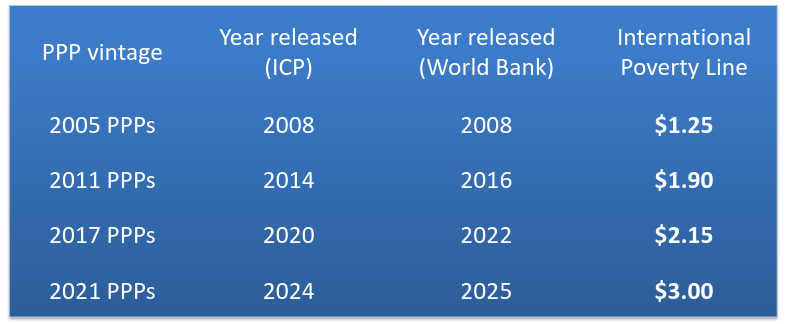
- In 2014 the International Comparison Program released PPP data from 2011, the first global update since the 2005 round.
- In 2020 the ICP released data from 2017.
- In 2024 it released data from 2021.
- Changes because of better estimates (like household services→better data on values of consumption) rather than only changes in poverty lines or data.
- New PPP data may have implications for both the value of the global poverty line and the estimated number of people below this line in each country.
- However, the recent upward revision is explained by revisions in the underlying national poverty lines rather than a change in prices: significant improvements in the quality of consumption data, through improved survey methods and more timely information on the cost of basic needs in the poorest countries of the world.
- The majority of the national poverty lines used in the new IPL are from 2020 or more recent.
- Results depend on relative evolution of prices and income, not everything is a network (stuff differs country-wise) and some countries benefit from PPP.
Changes
- Between 2000 and 2024, the number of people worldwide living below the US 3.00-a-day (PPP 2021) international poverty line fell from 2.23 billion to 839 million.
- With the exception of South Asia (India update), all regions see an upward revision in extreme poverty, especially Sub-Saharan Africa. As a result, the concentration of extreme poverty in Sub-Saharan Africa is becoming even more pronounced.
 Old data→New data→New data & PPP. Important to always use the most recent estimates.
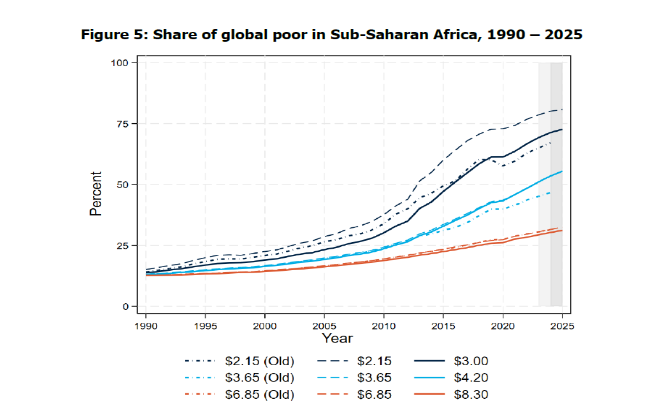 Most affected by new computations although trend is always upward. We can see that they have many living with less than 3$. Poorest region.
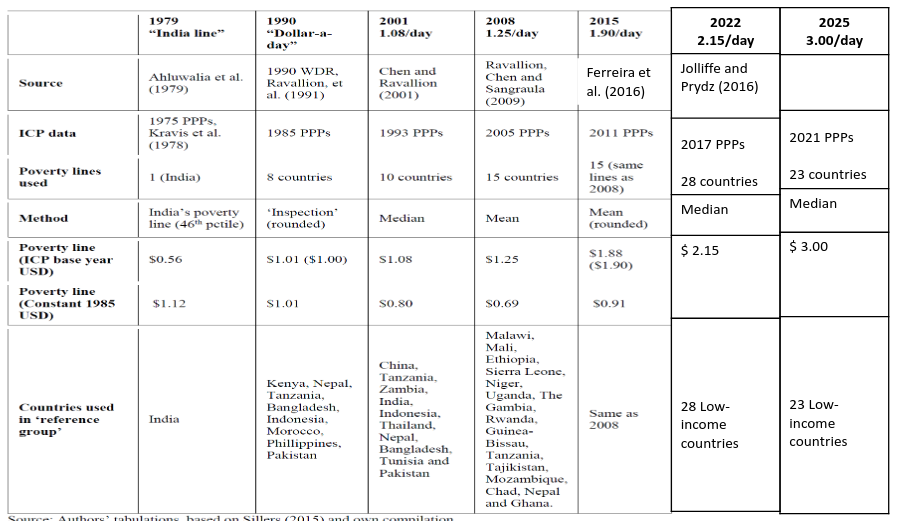
IPL for the poorest
The 1.25 US$ per-day income per capita international poverty line (IPL) was based on taking the average value of national poverty lines from 15 of the poorest economies in the world (Chad, Ethiopia, The Gambia, Ghana, Guinea-Bissau, Malawi, Mali, Mozambique, Nepal, Niger, Rwanda, Sierra Leone, Tajikistan, Tanzania, and Uganda) using the 2005 PPP values.
- The global poverty line using the same approach and countries but applying the 2011 PPP values was at 1.90 US$.
- New methodology applied in 2022 and 2025 using 2017 and 2021 PPP values. New methodology developed by Jolliffe and Prydz (2016) applied to IPL 2.15 and IPL 3.00:
- Larger and more representative sample of reference countries + updated information.
- Harmonised national poverty lines: all estimated poverty lines estimated at the country level are expressed in per capita (not in adult equivalent terms).
- Recent national poverty rates reported by countries themselves are used to retrieve the corresponding national poverty lines from consumption or income distributions.
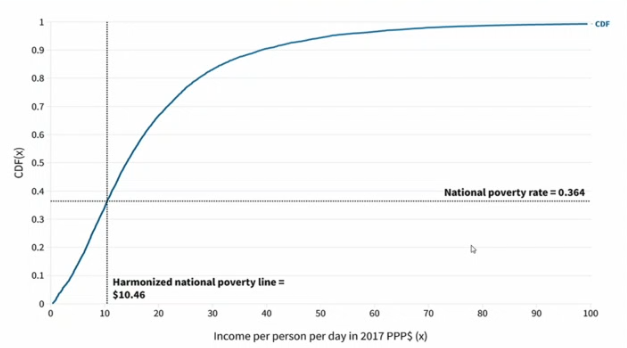
- Thanks to PPP and harmonising it we know it is comparable.
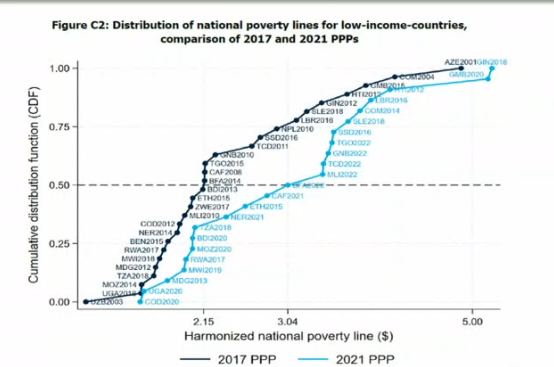 Some excluded because of lack of updates, here we can see that differences are big. Another reason for region exclusive IPLs.
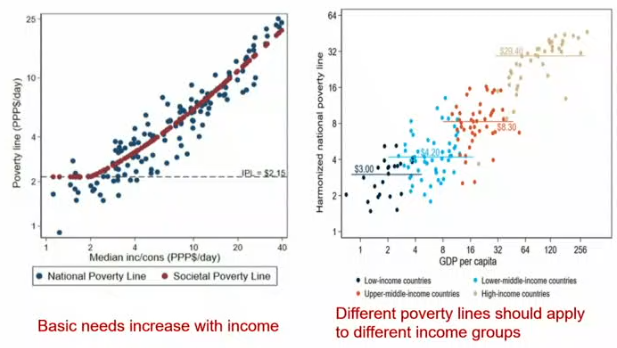 Indeed more money=more needs. For SDGs either way, we stay on extreme poverty (specially for the aforementioned reasons).
History of the WB’s IPLs
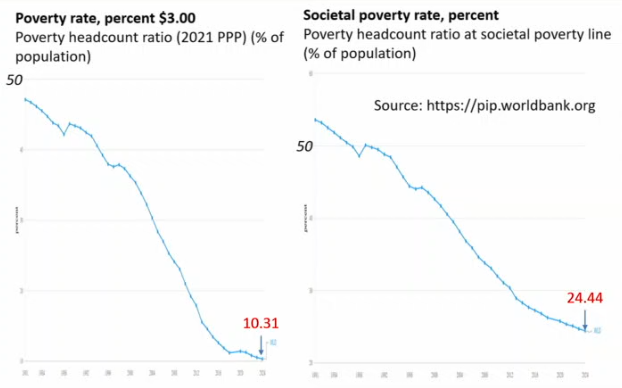
Societal poverty lines
- At the recommendation of the Atkinson Commission, the World Bank introduced in 2018 a Societal Poverty Line (SPL) as a complement to its existing absolute poverty lines.
- This line is a hybrid line that incorporates elements of both absolute and relative definitions of poverty.
- Unlike the International Poverty Line which is fixed for all countries in PPP terms, the Societal Poverty Line by construction varies over time and across countries as median consumption changes.
- Based on the work by Jolliffe and Prdyz (2021) and using the 2011 PPPs, the SPL was defined as max (1.00 + 0.5XMedian consumption). For example, for a country with median consumption of 2.50 (=$1+0.5X3.00).
- The SPL has three parameters: a floor at the International Poverty Line of 1.00, and a slope parameter of 0.5.
- The SPL has been updated with the 2021 PPPs.
- The Societal Poverty Line is revised to max (1.30 + 0.5XMedian consumption).
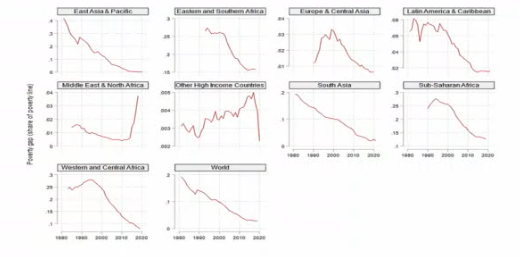
Measurement of incidence
Assuming that information is available on a welfare measure such as income per capita, and a poverty line, for each household or individual:
- The headcount index measures the proportion of the population that is poor.
- It is popular because it is easy to understand and measure.
- But it does not indicate how poor the poor are. The poverty gap index measures the extent to which individuals fall below the poverty line (the poverty gaps) as a proportion of the poverty line.
- The sum of these poverty gaps gives the minimum cost of eliminating poverty, if transfers were perfectly targeted.
- The measure does not reflect changes in inequality among the poor.
The poverty severity index: is a measure of the weighted sum of poverty gaps (as a proportion of the poverty line), where the weights are the proportionate poverty gaps themselves. Also known as the squared poverty gap index, the poverty severity index accounts for inequality among the poor.
The Watts index is another inequality-sensitive poverty measure: individuals are indexed in ascending order of welfare (obtained from consumption or income information), then the sum of the difference between the (ln of) poverty line and the (ln of) the welfare of individuals in poverty is calculated in per capita terms (total population).
Non-monetary indicators
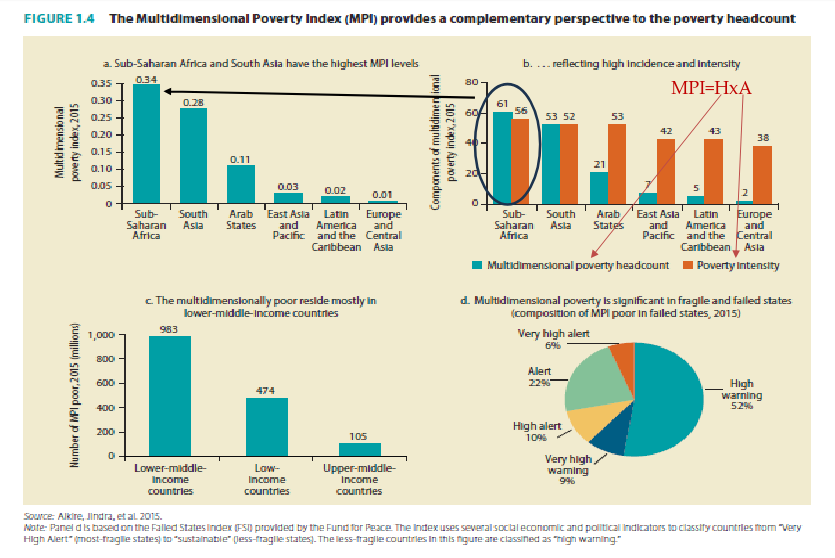
- The Oxford Poverty and Human Development Initiative and UNDP Multidimensional Poverty Index (MPI) is an adjusted headcount indicator that measures the incidence and breadth of those who are deprived in multiple dimensions.
- In 2018, the World Bank launched its own multidimensional poverty measure (MPM), building heavily on these prior efforts.
- The approach begins with a specification of the dimensions and indicators upon which poverty will be based.
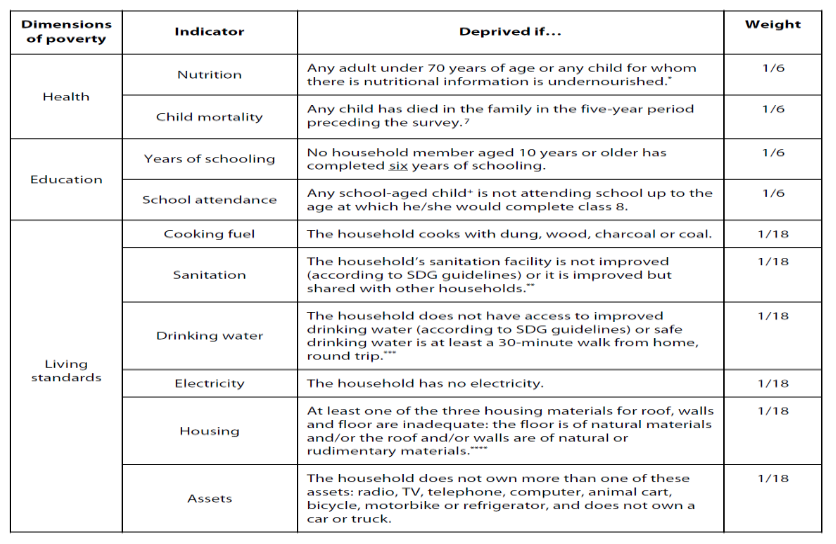
- The MPI identifies 3 dimensions: health, education, and standard of living.
- These dimensions are measured using 10 indicators: child mortality and nutrition (for health); years of schooling and school attendance (for education); and cooking fuel, toilet, water, electricity, floor, and assets (for living standards).
- Each dimension and each indicator within a dimension is equally weighted.
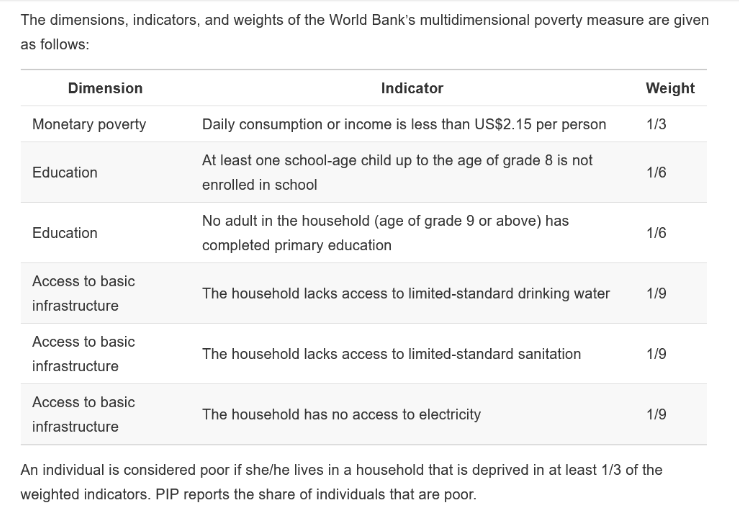 For monetary poverty we would use 3$ right now. Above chart is for the MPM. These are revised based on the data available in household service charts. In the case of the MPI:
 - For each of the indicators a deprivation cutoff is set: For example, for years of schooling, deprivation amounts to no household member having completed six years of schooling, whereas for electricity, deprivation means having no access to electricity.
- A person is considered poor if he or she is deprived in at least a third of the weighted indicators.
Computing MPI
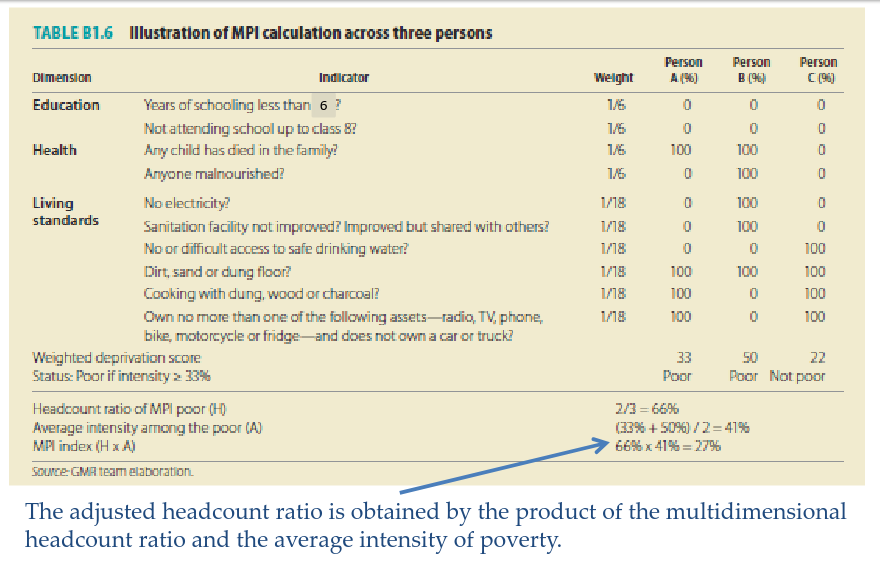 Not much attention dedicated to it right now, more towards the work of the WBG. It can be decomposed in headcount and average and that is useful f.ex. if we want to design policies based on prevalence of poverty amongst the inhabitants of a given region
Measurement with the MPM
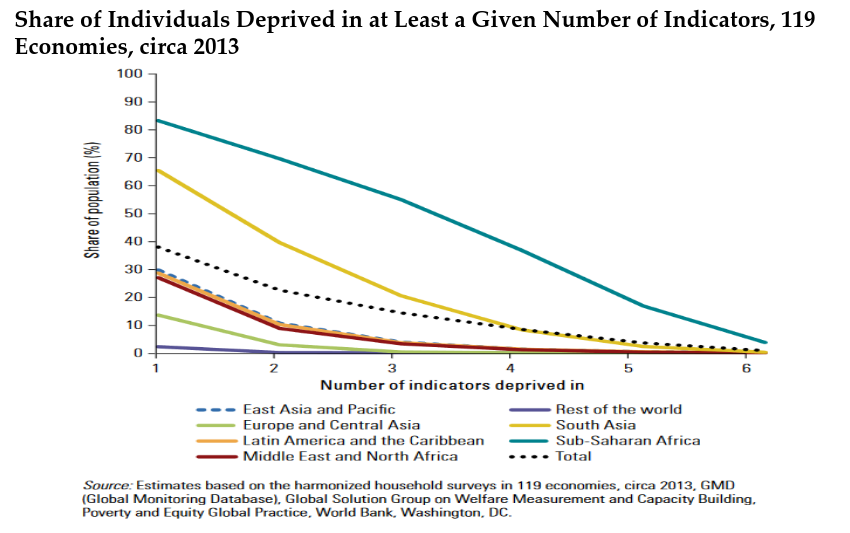
Can also be used to see which is the poorest region based in share of indicator deprivance, in this case Sub-Saharan Africa:
 Normally if you are deprived on 1/3 you are poor according to the MPM.
 Changing the definition of poverty (e.g., using multidimensional indicators instead of income or requiring deprivation in more indicators) increases the share of people classified as poor. However, the relative ranking of countries or regions remains broadly similar, because places that are poorer tend to experience multiple forms of deprivation simultaneously.
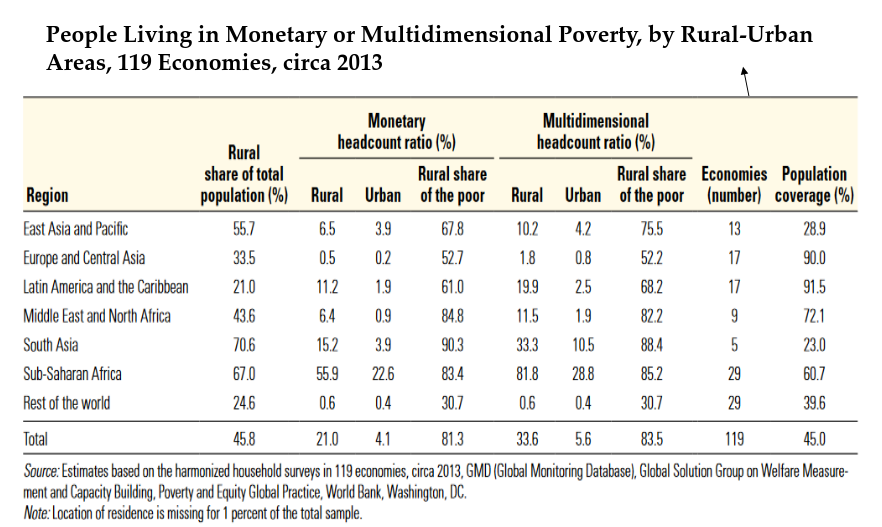
More rural poverty multidimensionally because we take into account the lack of infrastructure in the countryside, we can be more precise.
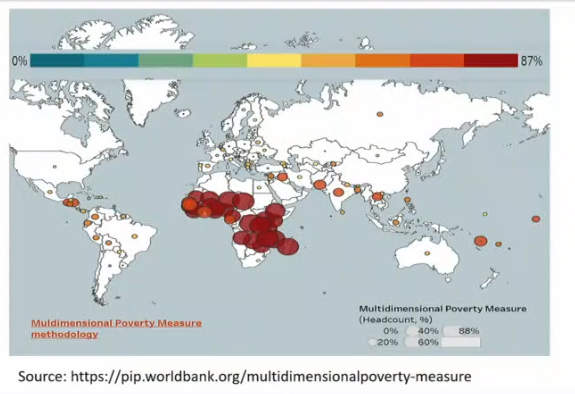 The bigger the dot the bigger the deprivation headcount for MPM.
Basically the lesson to be reached here is that similar conclusions can be reached with different definitions but with difference in precision sometimes, or with caveats. So it’s important to choose accordingly.
Fighting poverty
View has evolved, good to take people out of poverty but only if they stay out of it in the long term. We have lots of them falling into poverty, it’s not static but there are dynamics related to the phenomena that require identification for better policy.
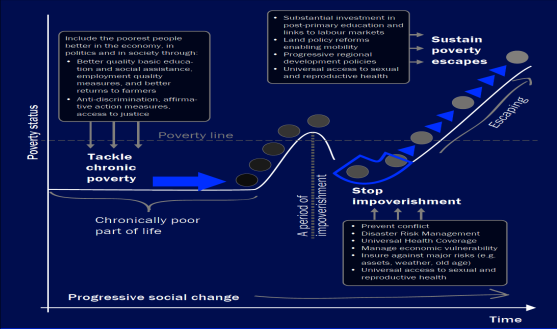
- The chronically poor – those who are poor for many years, or for their entire lives, and who often pass their poverty down to their children – need to be at the center of poverty eradication policies, and there needs to be far more emphasis on stopping impoverishment: the descent into extreme poverty.
- Until now, the focus has been on helping people to escape from poverty, but for those living in chronic poverty, who often face multiple disadvantages, any escape is likely to be short-lived.
- In order to get close to zero extreme poverty (less than ), policies must aim for three separate but interdependent objectives:
- Tackle chronic poverty.
- Stop impoverishment.
- Sustain poverty escapes.
- To keep people out of poverty a multidimensional view of these dynamics is necessary.
- All three are needed if the eradication of extreme poverty is to be sustained, and all three require massive global investment.
Policies
There are three policies that address them all:
- Social assistance brings the poorest people closer to a decent standard of living, provides a safety net for them in tough times, and encourages them to make the investments and take the risks that could propel them out of poverty, and keep them out of poverty.
- It is necessary to create them first, which can be a problem of its own.
- Massive investment in education, which enables escapes from poverty and sustains the climb away from it, also has the advantage of being a portable asset that is resilient to crises.
- There have been big ones in primary education but studies show that secondary education is important, specially now with tech changes that concerns the rich and society as a whole so they have to be able to adapt to these innovations and capacity to adapt to evolving situations can be facilitated by secondary+primary.
- Pro-poorest economic growth ensures that the benefits of increasing national prosperity reach the very poorest people for instance by introducing a minimum wage→trickle down economics.
- Basically that growth creates jobs and they have to be available to the majority of the population. 8% of the labor force can be informal in some countries and growth can create opportunity to reverse a part of this, incentivised by generous welfare systems perhaps.
- Normally these welfare systems would be associated with indirect or direct and progressive tax systems to finance them.
- Basically that growth creates jobs and they have to be available to the majority of the population. 8% of the labor force can be informal in some countries and growth can create opportunity to reverse a part of this, incentivised by generous welfare systems perhaps.
Impoverishment
- The next figure depicts a life history of impoverishment caused by a combination of individual shocks and economic vulnerability.
- The main negative events in the life of Emanueli were: missing the chance to complete his education; the separation from his wife, which was accompanied by the loss of some assets; and the confiscation of his fishing nets by the Government.
- Emanueli’s story reveals the absence of mechanisms of insurance or social assistance that could have helped him to cope with and recover from the events that derailed his life.
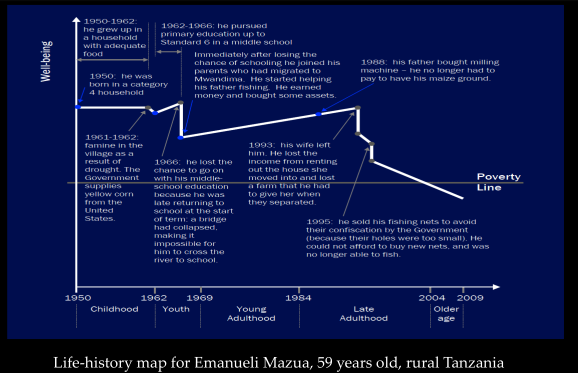 Social assistance could have helped take him out of poverty. It is useful to protect from negative shocks.
Social norms are also important, habits can affect the existence and prevalence of poverty in some populations:
- Social norms and values can also be considered a part of the enabling environment, as they affect people’s behaviour and the impact of their actions.
- They influence, for example, how people behave in terms of the numbers of children they decide to have, and therefore the speed of the demographic transition. But they also influence a host of other aspects of social relationships – marriage, inheritance, how employers treat employees, and so on.
- The story of Selina (next Figure) shows how social norms and prejudices are highly correlated with chronic poverty.
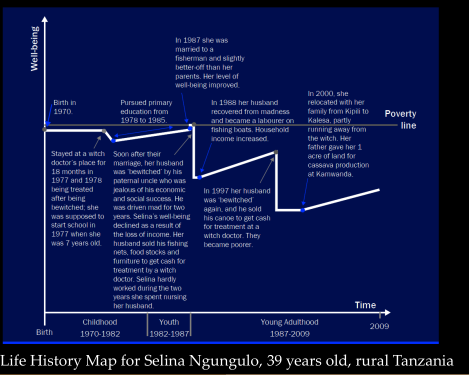 Was never able to get of poverty because, apart from lacking social assistance, her husband was bewitched by someone… which is purely a cultural and social phenomena.
In conclusion
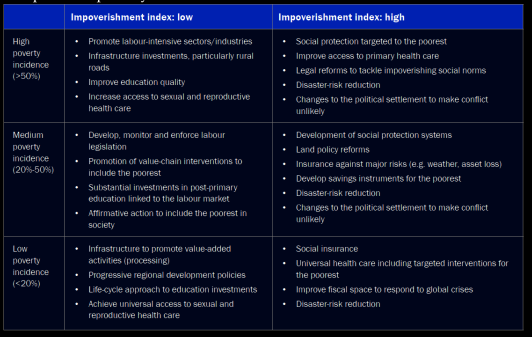
In a nutshell: Policies to tackle chronic poverty, stop impoverishment and sustain escapes from poverty.
 Some people might for example not pursue education and stay in the informal sector as they do not see the long term payoffs of education as viable in their current environment compared to the short term ones of the informal sector where they might have a better network. Poverty dynamics are complicated and holistic.
In practice: Policy priorities, based on ratio between descents into poverty to
escapes from poverty.