Developed versus Developing countries
How is development conceptualised? What are the indicators used to classify countries or show evolution?
GNI/capita
- World Bank Scheme ranks countries (2024) on GNI/capita calculated using the World Bank Atlas method to convert all currencies to USD.
- Allows to see economic wealth produced within a country within a timeframe (normally a year).
- Identifies different groups of countries, for practical reasons, by GNI/capita. A big country produces more than a smaller one usually because of important differences in production factors (influenced by size, population, etc…) which is why we use per capita measure of GNI.
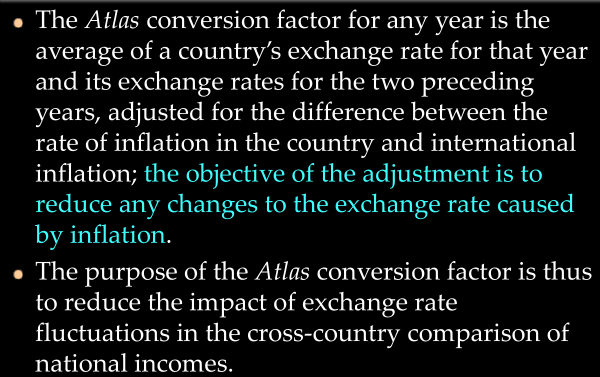
Atlas method
- Each country uses a different currency for its income so we cannot compare them just like that.
- Basically we use the Atlas method, a conversion factor, to take into account differences between currency values.
- Basically we use the Atlas method, a conversion factor, to take into account differences between currency values.
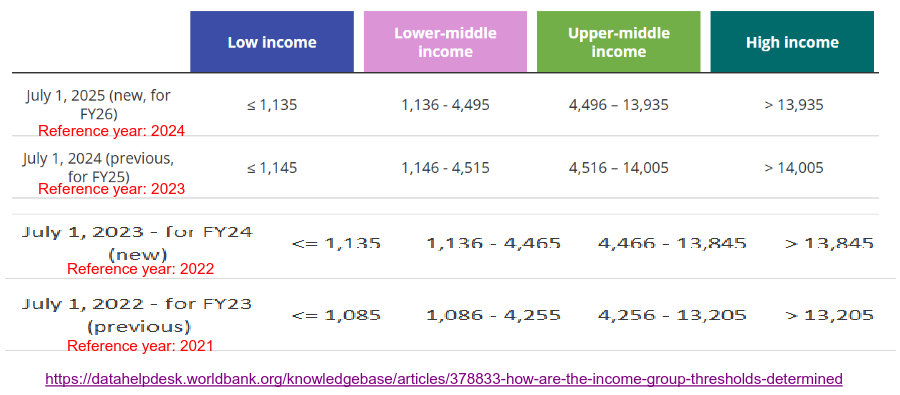
Categories
- The WB, with its experience, has created thresholds for each category that can be revised according to the methods used to calculate Atlas. This way we classify among Low income←>Lower-middle income←>Upper-middle income←>High income.
- These are not necessarily based only on theoretical models as they are also based on practical stuff like how much you need to live in a certain way in a certain place around the world.
- With these categories, we determine which country could benefit from transfers among other things.
Regionally
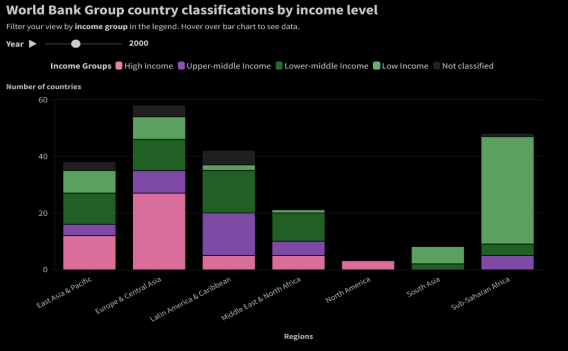
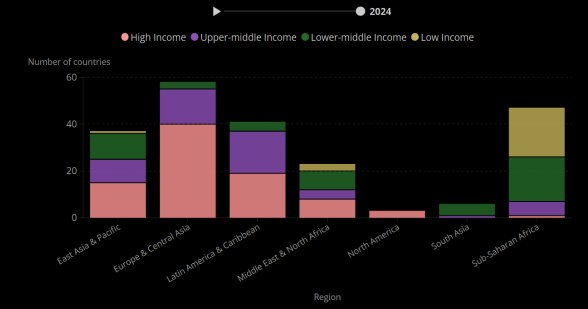 There has been an improvement, e.g. in Sub-Saharan Africa.
Transitions
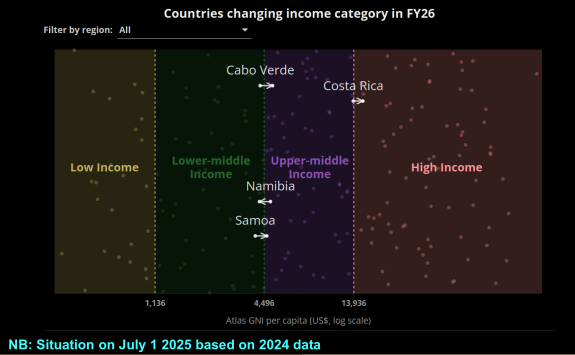 Usually shifts are not huge, sometimes it’s the thresholds that change. Contributors are usually to the right and viceversa.
Purchasing power parity
- Income/standards of living vary substantially across the globe.
- Comparing income or consumption or poverty levels among countries requires a common unit of measurement.
- Exchange rates reflect the relative value of currencies as traded in the market.
- Purchasing power parities take into account differences in price levels (this is not inflation).
- Having 1 USD in Switzerland and in Gambia isn’t the same thing.
- Normally we compare by baskets (primary necessity goods, etc…) depending on the type of good.
- With the same income we may be able to purchase different amount of baskets/goods in different countries.
- This we call a real exchange rate.
- Both conversion factors have important roles in measuring the size of economies.
- Instead of expressing something in USD without inflation we compare to a given set of goods. Exchange rates are defined in international markets and may not always reflect real differences in purchasing power.
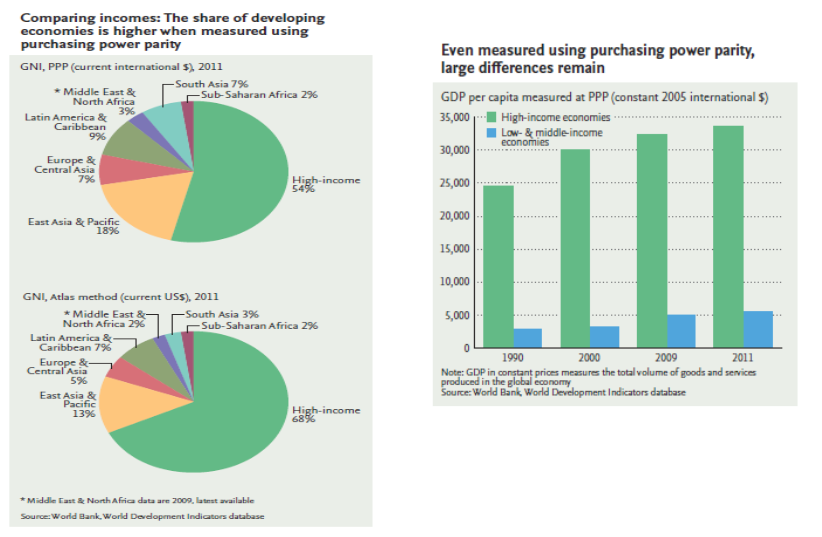 Share of global income: PPP (up) vs. Atlas method (down). The share of developing economies is higher when measured using power parity. They make less but can buy more. However, big differences remain between high and low/middle-income countries.
- Instead of expressing something in USD without inflation we compare to a given set of goods. Exchange rates are defined in international markets and may not always reflect real differences in purchasing power.
Developed versus Developing countries
- The UN classifies all countries of the world into one of two broad categories: developed economies and developing countries.
- Distinction since the 50-60s lot has changed since then.
- There were transition economies before (ex-USSR planified→market economy) not anymore. Some became developed.
- The classification of economies by development status is intended for statistical convenience and does not express a judgement about the stage reached by a particular country or area in the development process.
Composition
- The developing economies broadly comprise Africa, Latin America and the Caribbean, Asia without Israel, Japan, and the Republic of Korea, and Oceania without Australia and New Zealand.
- The developed economies broadly comprise Northern America and Europe, Israel, Japan and the Republic of Korea, as well as Australia and New Zealand.
Other groups
- Other subgroups based on development status include fragile and conflict-affected situations, least (less sometimes) developed countries (LDCs), landlocked developing countries (LLDCs) and small island developing States (SIDS→more for like speaking of one voice and defend their interests like with rising waters).
- Not only nations, situations. Also fragility (possible future conflict). These have special needs and international aid. Can change across time.
- Historical inertia plays a role, most groups (except ex-transitioning countries) are constant.
FCS
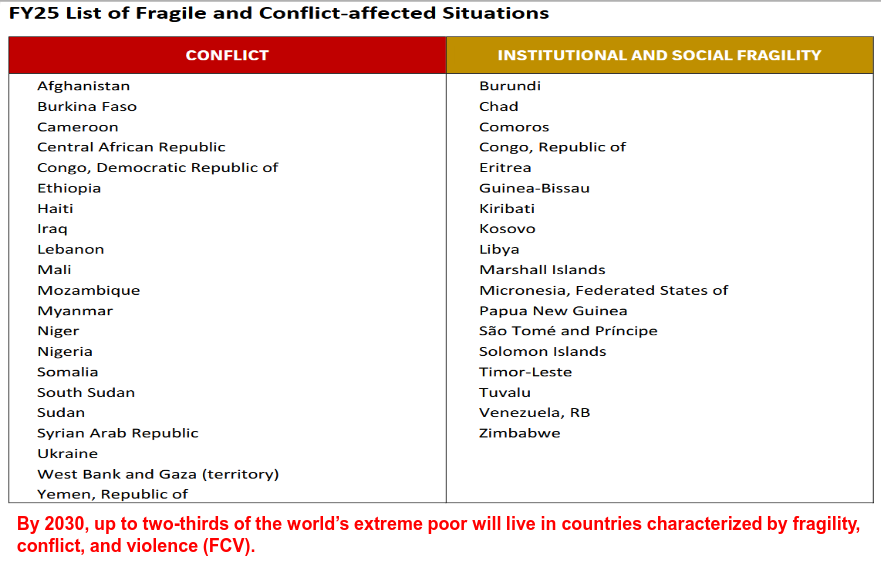
The list of fragile and conflict-affected situations (FCS) is released annually by the World Bank Group (WBG) and aims to inform strategic and operational decision-making within the WBG.
- PURPOSE: The list functions primarily as a tool to help the WBG adapt its approaches, policies, and instruments in difficult and complex environments seeing what the problems in the countries are and that the concerns are. But objectives can vary, we see that it varies between IOs. In WTO similar countries in classification speak together f.ex.
- SCOPE: Given the complexity of fragility and conflict, the list is not meant to be comprehensive— it does not include all countries affected, nor is it a ranking of countries.
- SOURCES/METHODOLOGY: The list is based on publicly available global indicators followed by an internal review; and is updated every year on July 1st to reflect changes in country situations.
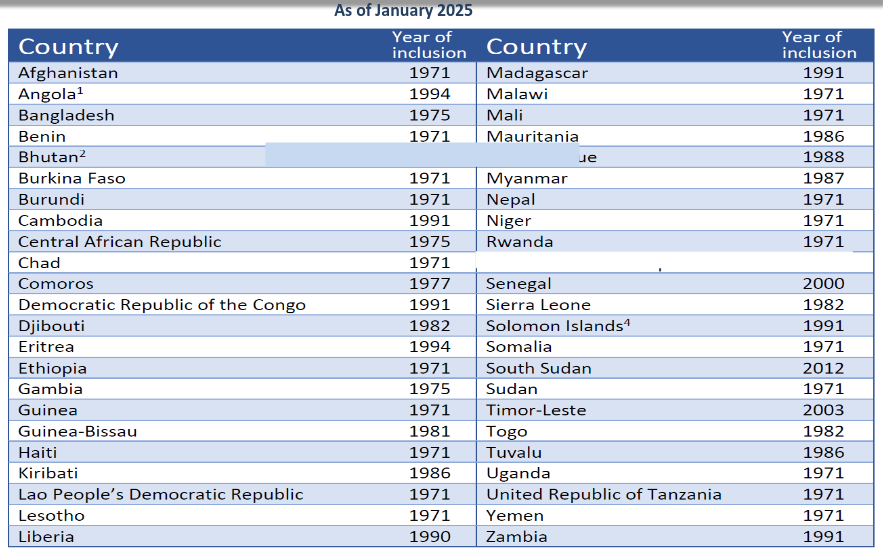
LDC
The list of the least developed countries (LDCs) is decided upon by the United Nations Economic and Social Council and, ultimately, by the General Assembly, on the basis of recommendations made by the Committee for Development Policy (CDP).
- This list can change, it’s primarily used for special and differentiated treatment in settings like the WTO.
- Giving free access to domestic markets to LDCs. Abandoning the statuts of LDC will thus have consequences. That is why we have a committee specialised on this, to ensure a smooth transition. A transition period is in fact given.
- Very important for the UN Secretariat’s work.
- The basic criteria for inclusion require that certain thresholds be met with regard to per capita GNI, a human assets index and an economic vulnerability index. It’s not only a quantitative economic process but a qualitative political one. Other dimensions other than income are accounted for.
Criteria
The following three criteria (thresholds for inclusion and for graduation) are used by the CDP to determine LDC status:
- Per capita income (gross national income per capita).
- Human assets (indicators of nutrition, health, school enrolment and literacy).
- Economic vulnerability (indicators of natural and trade-related shocks, physical and economic exposure to shocks, and smallness and remoteness - landlocked countries f.ex. which for trade has to go through transit countries or use a plane which you can’t use for everything and is expensive→access to international markets can be more difficult without a sea - ).
Distribution
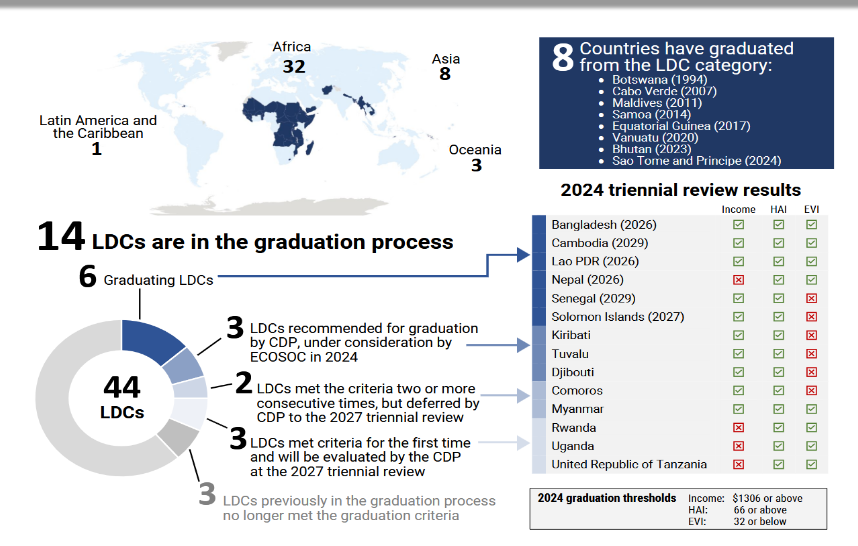 Most in Africa, correlation with low income group almost perfect. Some in Asia and only one in the Caribbean (Haiti). Islands in Oceania also count, as they are very remote and small. But you can also have large countries like Bangladesh, because it checks every other factor.
As we can see, some countries graduate. This is the case of Bangladesh in 2026… but with all the turmoil internationally (shocks because of USA) might be next year.
 This isn’t an unique or absolute definition of what/who is development/ed.
What is development
- It is somewhat easy to say which countries are richer and which are poorer as long as economic activities are accounted for.
- But indicators of wealth, which reflect the quantity of resources available to a society, provide no information about the allocation of those resources.
- For instance, a measure of wealth does not reveal anything about more or less equitable distribution of income among social groups, about the shares of resources used to provide free health and education services, and about the effects of production and consumption on people’s environment.
- E.g. GNI/capita is an average, not an indicator about distribution. Averages are strongly impacted by the values of the extremes. There is likely to be a positive correlation between GNI/capita and spending on public stuff but it’s an average generally validated not always. Nations showing high exporting rates of commodities like oil dont fit into this correlation f.ex.
- Using one or more factors is a political decision up to some extent and entails a political process to make such a change.
- There is no unique definition of development, only the possibility of reaching certain conclusions when it comes to certain definitions of it.
Indicators
New View of Development in IOs (consensus specially for SDGs): human development is the end—economic growth a means. Growth is needed for decent income by the creation of economic wealth and then provide(/allow access) them with services. There are other ways, but economic development is considered the easiest one. We look at growth (economic) a lot because it is easier to quantify by the way.
Traditional Economic Measures
- GNI (Gross National Income).
- Income per capita.
Sen’s Capabilities Approach
- Capabilities as freedoms enjoyed in terms of functionings.
- Functionings (the states and activities constitutive of a person’s being – e.g. being healthy, having a good job, being happy…) as an achievement.
- Can be many more things such as availability of cultural activities.
- Development and happiness.
- Well-being in terms of being well and having freedoms of choice, fair access to these functionings.
- We go beyond having a decent salary (economic development) in this approach.
- Very subjective though (apart from moralistic or comprehensive), it’s not the same activities that make everyone happier→depends on aspirations. But development here is associated to enjoying one’s life… What is happiness or a decent job? Health is more straightforward f.ex.
Todaro’s Three Core Values of Development
- Development is not purely an economic phenomenon but rather a multi-dimensional process involving reorganisation and reorientation of the entire economic and social system. Development is the process of improving the quality of all human lives within three equally important aspects. It is multidimensional and not only monetary, like with Sen.
- Raising peoples’ living levels (sustenance), i.e. incomes and consumption, levels of food, medical services, education through relevant growth processes.
- Materialistic part of the definition.
- Creating conditions conducive to the growth of peoples’ self-esteem through the establishment of social, political and economic systems and institutions which promote human dignity and respect.
- Not being excluded, can also be a political system dimension apart from economical.
- Related to democracy perhaps.
- Increasing peoples’ freedom to choose by enlarging the range of their choice variables, e.g. varieties of goods and services.
- Very related to Sen’s approach.
- Having private and public education f.ex. can increase variety and, therefore, access.
- Raising peoples’ living levels (sustenance), i.e. incomes and consumption, levels of food, medical services, education through relevant growth processes.
Therefore
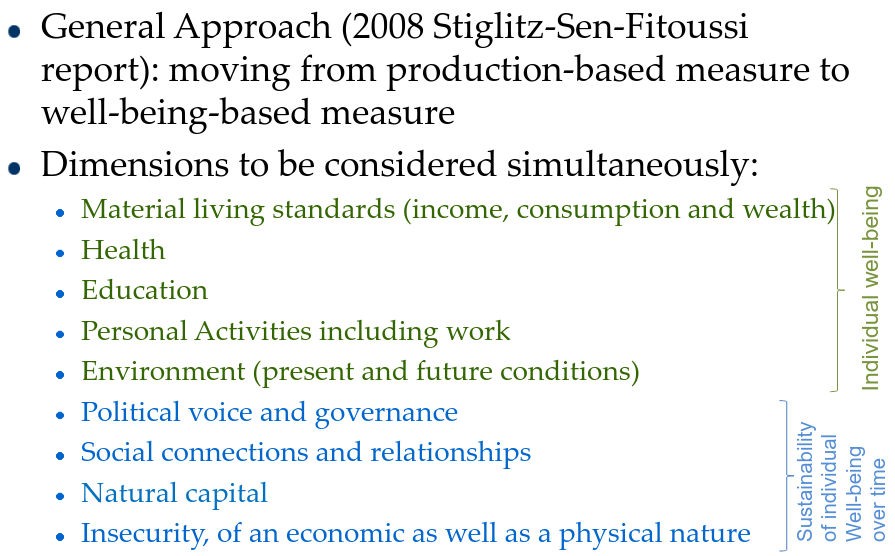 OCDE considers that indeed we can’t only look at the economic dimension of development. Dimensions that maintain and promote a certain level/dimensions of well-being have to be considered. There is a materialistic side to all of this (health, education, etc…). Personal activities and environment are less so. When it comes to sustaining well-being we focus a lot on the institutional frameworks in which individuals evolve.
Objectives of development
We have dimensions that go outside purely nominal monetary indicators but we are still mainly within these as they are easier to measure (we dispose of comprehensive information about them). Regardless, based on what has just been discussed, the objectives should be:
- To increase the availability and distribution (for maximum number of people equally/in a fair manner) of basic human necessities.
- To improve standards of living for the majority of people.
- To expand the range of economic and social choices and opportunities (work, cultural activities).
Conclusion on indicators of development
- GDP (Gross Domestic Product) is a measure of national income / national output and national expenditure produce in a particular country.
- GNI (Gross National Income, formerly referred to as GNP) = GDP + Net property income from abroad (it includes, dividends , interest and profit). GNP/GNI includes the value of all goods and services produced by nationals whether in the country or not.
- GNI and GDP both reflect the national output and income of an economy. The main difference is that GNI takes into account net income receipts from abroad.
- The distinction is made because we are interested in what nationals make, whether it’s domestically or abroad. In this case we use GNI.
GNI by PPP
- In previous slides GNI has been shown in per capita terms (wealth indicator) and has been expressed in U.S. dollars but also adjusted with the help of a purchasing power parity (PPP) conversion factor.
- The PPP conversion factor controls for price levels differentials (not inflation) and shows the number of units of a country’s currency required to buy the same amount of goods and services in the domestic market as one dollar would buy in the United States.
- Example: nominal exchange rate (2022) Yen/$US: 131.
- PPP conversion rate (2022) Yen/$US: 95.
- By applying this conversion factor, instead of a country’s nominal GNI per capita (expressed in U.S. dollars in accordance with the market exchange rate of the national currency) we obtain a real GNI per capita that reflects the difference in prices for the same goods and services between this country and the United States, and independent of the fluctuations of the national currency exchange rate.
- GNI per capita in PPP terms thus should provide a better comparison of average income or consumption between economies (PPP convertor may not be updated for several years).
- Countries with similar average incomes can differ substantially when it comes to people’s quality of life: access to education and health care, employment opportunities, availability of clean air and safe drinking water, the threat of crime, and so on.
- Clear need for alternative/complementary measures of development.
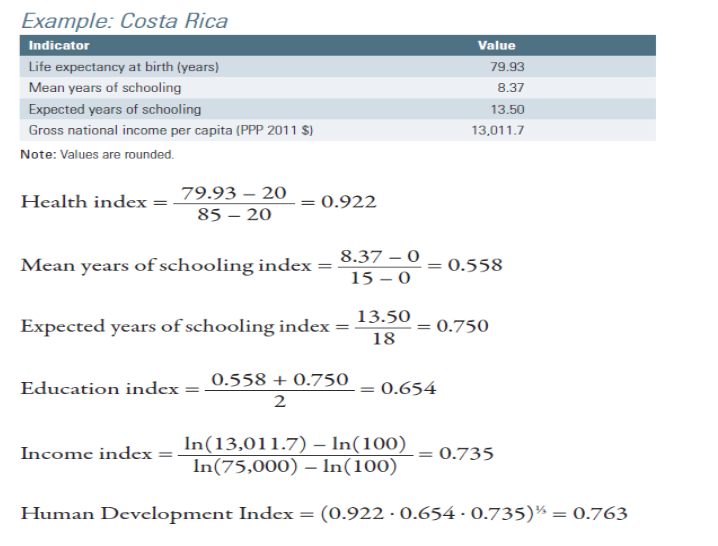
Human Development Index (HDI)
- The Human Development Index (HDI) is a holistic measure of living levels first published in the 1990 annual Development Reports of the United Nations Development Programme (UNDP).
- The HDI is a summary measure (i.e. a composite index) of achievements in key dimensions of human development: a long and healthy life, access to knowledge and a decent standard of living.
- You look at one index, but a multidimensional one→easy and more faithful comparisons.
Computation
 We do a geometric mean of the dimension indexes so as to not give too much weight to values that are usually higher (e.g. life expectancy). This is just a normalisation process so as to get rid of the unit of measurement and remove biases (we take into account the ranges→max-min). It is however necessary to fix the maximum and minimum values for each indicator. The geometric mean allows use to reduce the impact of extreme values, this way you cannot compensate between values.
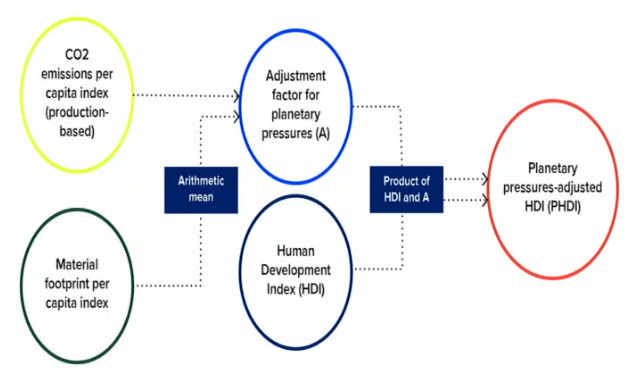
Carbon footprint
- Planetary-pressures adjusted HDI: The adjustment corresponds to multiplying the HDI by an adjustment factor, creating the PHDI.
- If we want to be holistic in development we are going to need to consider the natural footprint of a country on the planet as well. If not, development is achieved by harming the planet.
- The adjustment factor is calculated as the arithmetic mean of indices measuring carbon dioxide emissions per capita and material footprint per capita.
- A country’s material footprint measures the amount of material extracted (biomass, fossil fuels, metal ores and nonmetal ores) to meet domestic final demand for goods and services, regardless of where extraction occurs. It is a consumption-based measure that accounts for international trade.
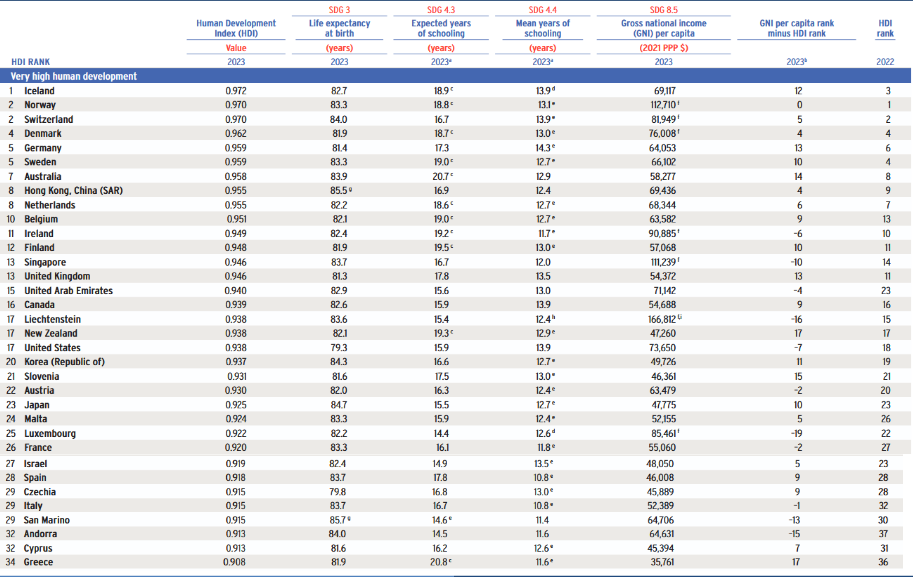 HDI is more composite, many countries here like Liechtenstein or Singapore lose ranks when using HDI as comprared to GNI/capita.
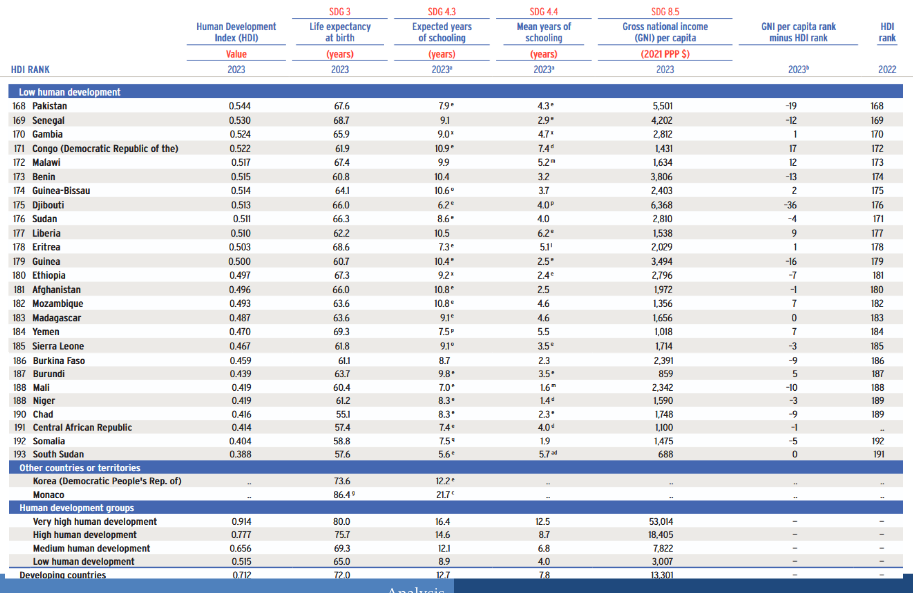 Low ranking countries don’t do that bad on the GNI/capita score but have serious problems on the other dimensions of the HDI. For many HDI is, again, negative; although exceptions exist.
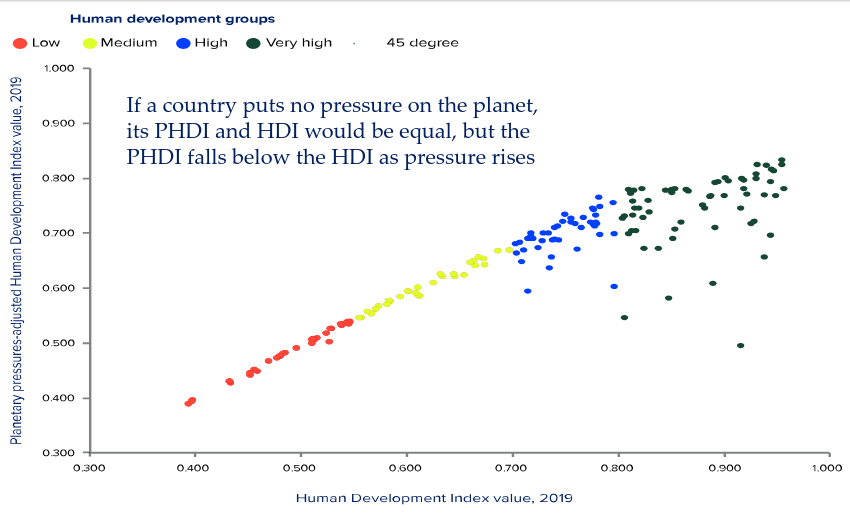 The farther a country is from the line (45º from 0) the tougher the adjustment (petrol exporting countries f.ex). Also, it is impossible to be above it statistically→has never been recorded. For very high HD groups they can only improve their PHDI, not the HDI as much.
- A country’s material footprint measures the amount of material extracted (biomass, fossil fuels, metal ores and nonmetal ores) to meet domestic final demand for goods and services, regardless of where extraction occurs. It is a consumption-based measure that accounts for international trade.
Back to the OECD
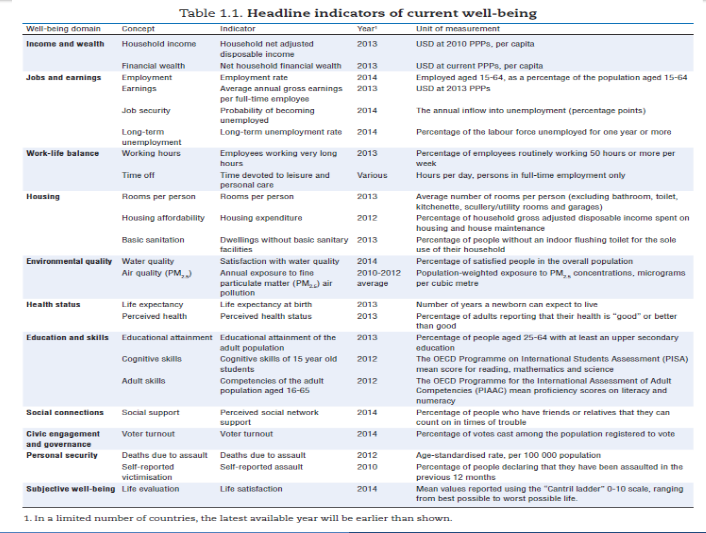
- The OECD framework for measuring well-being was first introduced in How’s Life? 2011.
- It builds on a variety of national and international initiatives for measuring the progress of societies using a broad set of metrics, as well as on the recommendations of the Stiglitz, Sen and Fitoussi report (2009).
- Conceptually, the framework reflects elements of the capabilities approach (Sen, 1985; Anand, Durand and Heckman, 2011), with many dimensions addressing the factors that can expand people’s choices and opportunities to live the lives that they value – including health, education, and income.
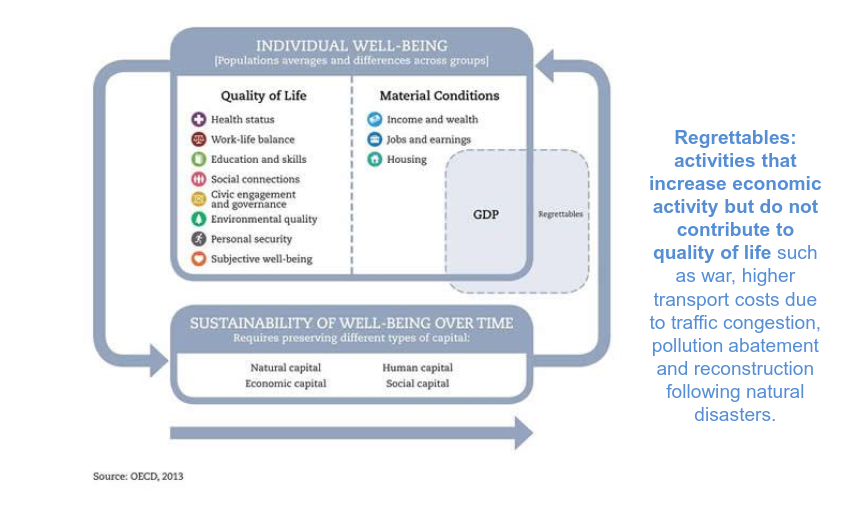 The regrettables are not always identifiable.
 On another note, we can add as many variables as we want and be holistic, realistic, etc… but many countries don’t have the strength to provide us with up to-date real statistics. Many indicators thus have to take old data, or none. Some indicators such as household income have to be extracted from interviews, this is another difficulty.
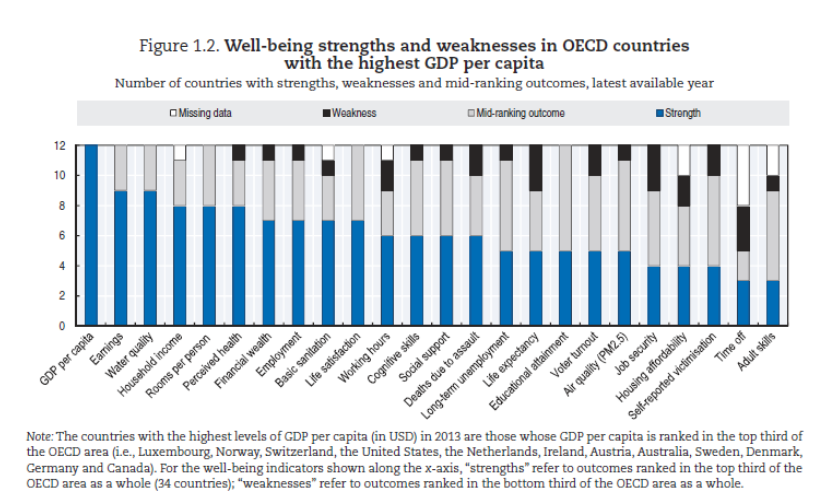 Very good at GDP/capita but many other indicators are not perfect, that’s where more policy attention has to be devoted to (e.g. life expectancy). We do not necessarily need to compare countries for this as we can see.
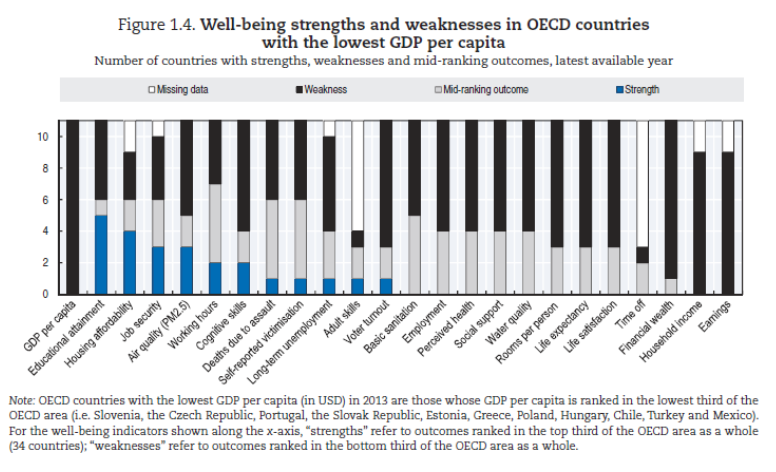 Same but with lowest GDP/capita in OECD. Here we can see more problems in more areas. This is useful to see which dimensions we can take into account when pursuing for example higher GDP/capita knowing that we have issues on other stuff and we shouldn’t forget them.