The environment and climate cooperation
Trade and the Environment
The relationship between international trade and environmental outcomes has been, and remains, contentious:
- Since 1970, trade liberalisation has generated a rapid increase in trade volume and has driven economic growth and prosperity.
- At the same time, increased globalisation due to trade is blamed for widespread environmental degradation, especially in developing countries.
- Despite these facts, it does not exist compelling empirical evidence of a causal negative effect of trade on the environment.
The evolution of International Trade
Trade has grown remarkably over the last century:
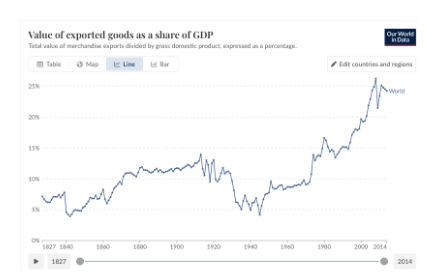
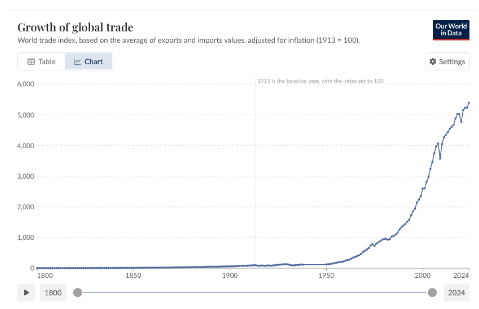 The increase in trade has even outpaced economic growth:
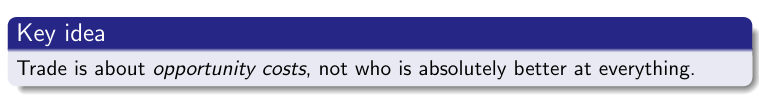
Understanding the gains from trade
- Why do you think countries trade with each other?
- What are the gains from trade?
- As seen in Introduction à l’économie internationale
Basic principles of international trade
- Since Adam Smith in 1776 and David Ricardo 1817, many economists have believed that countries, as a whole, benefit by an increase in welfare from freer trade.
- Trade allows countries to specialise in producing goods for which they have a lower opportunity cost.
- Countries can achieve a higher level of consumption than they could achieve without trade.
- These principles have underpinned global trade negotiations under GATT and WTO.
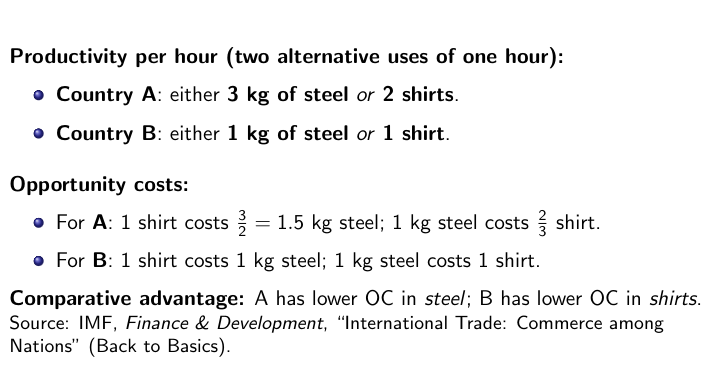
Comparative advantage
Introduced by Ricardo in around 1817, the concept of comparative advantage states that countries can gain from trade so long as the opportunity cost of producing goods is different between potential trade partners, even when there is no absolute cost advantage to one of these countries.
Comparative vs. Absolute Advantage (intuition)
- Absolute advantage: produce a good using fewer inputs (i.e., technological advantage).
- Comparative advantage: produce a good at lower opportunity cost.
- Two countries can both gain from trade if each specialises where its opportunity cost is lower, then trades.
Setup: Country A and B
Specialisation and a mutually beneficial trade
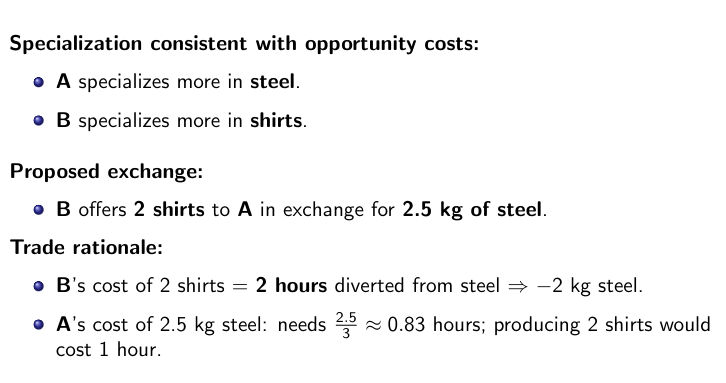
Accounting the gains from trade (step-by-step)
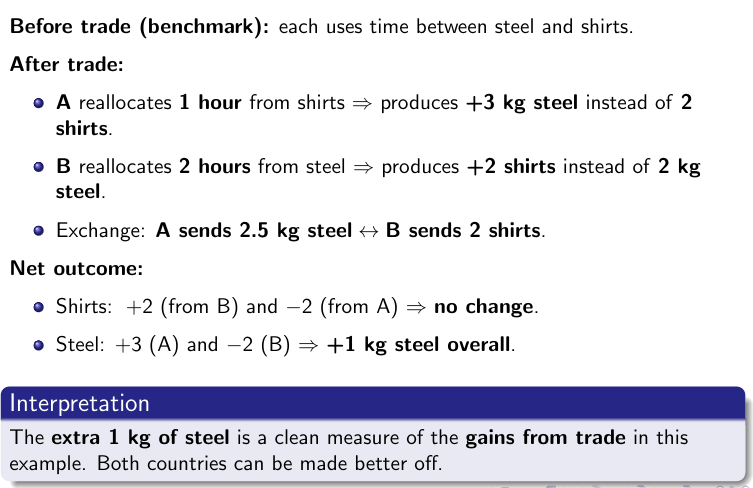
Takeaways and Bridge
- Comparative advantage ⇒ specialise where opportunity cost is lower ⇒ gains from trade.
- Gains do not require absolute superiority; they rely on relative trade-offs.
Why gains from trade matter for climate policy
- Trade raises incomes and spreads technology ⇒ potential for cleaner production.
- But trade also reshapes specialisation ⇒ carbon leakage risks if policies diverge.
- Therefore: to preserve the gains while cutting emissions, countries need compatible rules: WTO-consistent standards, mutual recognition, border adjustments, and international cooperation.
Trade and the Environment - Copeland and Taylor (1994)
- Scale effect: as an economy grows, emissions rise through a simple quantitative effect. This is a negative effect.
- Technique effect: trade-induced economic growth raises income, improve technology, and demand for environmental quality.
- Responsive governments and industries introduce legislations and technologies to reduce environmental degradation. This is a positive effect.
- Composition effect: trade leads to specialization.
- Countries with comparative advantage in ”dirty” goods pollute more; those with advantages in ”clean” goods pollute less.
- Most economies produce both clean and dirty goods, so that the net effect is ambiguous.
Stylised Fact 1: Dirty industries are more exposed to trade
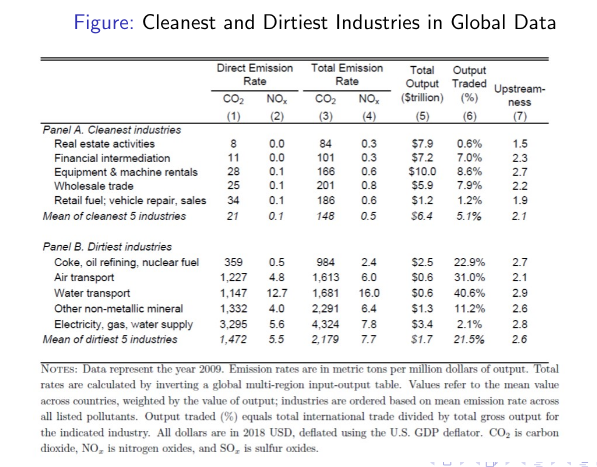
- Outputs from dirtier industries are more often traded than outputs from clean industries are.
- In part this pattern occurs because manufacturing industries are relatively dirty while services are cleaner, and manufacturing goods are more often traded.
- Why are dirty industries more trade exposed?
- Services use relatively more labor as a factor of production, which is relatively clean, while dirty industries use more energy and capital, which are dirtier factors.
- Dirty industries tend to have lower tariffs and non-tariff barriers, which encourages trade (Shapiro 2021).
Stylised Fact 2: Different types of pollution are correlated
- Previous table also shows that CO2 emissions are correlated with NOx emissions, though not perfectly so.
- A limit set of inputs, particularly fossil fuels, account for most greenhouse gases and a large share of air pollution emissions.
- Although many abatement technologies target one pollutant at a time, industries highly regulated for one pollutant tend to be highly regulated for others.
Stylised Fact 3: Dirty industries are more upstream
- Column (7) of Table 1 shows how upstream the industry is from final consumption.
- Antras et al. (2012) define a continuous index of upstreamness which ranges from one (least upstream) to five (most upstream);
- Downstream industries primarily serve final demand. The most upstream industries primarily sell to other industries that then in turn tend to serve other industries.
- One can think of upstreamness as a measure of an industry’s economic distance from final demand.
- A broad explanation for this pattern has to do with the close relationship of pollution emissions and the positioning of industries in global value chains.
- Dirty industries tend to be relatively upstream, since they sell more of their output to other industries rather than to final consumption, and they sell to relatively upstream industries.
Stylised Fact 4: More productive Plants are Cleaner

- More productive plants have lower pollution intensity:
- The slope, which is also an elasticity, is close to minus one. This suggests that output from plants that are ten percent more productive emits about ten percent less pollution per dollar of output.
- If productive firms require fewer inputs to produce a given output, and if pollution is closely related to the amount of fossil fuels or other inputs, then more productive plants may have less pollution per unit output.
- Finding that more productive firms and plants are cleaner suggests that reallocation across firms could be an important mechanism for trade to affect the environment.
Stylised Fact 5: Pollution emission rates differ substantially across countries
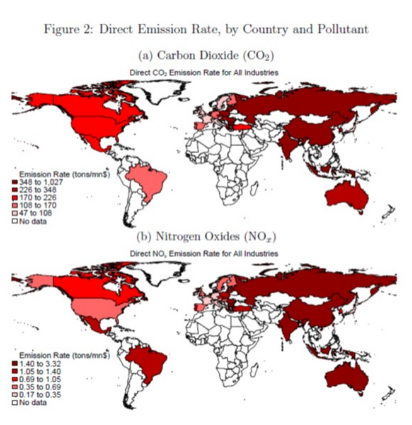
- For most pollutants, the lowest emission intensity is recorded in Europe, while USA and Canada have slightly higher intensities.
- Mexico and Brazil have higher emission intensity than the USA and Canada.
- Emissions in Asian countries and Oceania are more intense than in other regions.
- Countries with higher emission intensities have values up to 20 times higher than countries with lower emission intensities.
- Developed countries like Germany focus on services and import those goods for which they do not posses a comparative advantage.
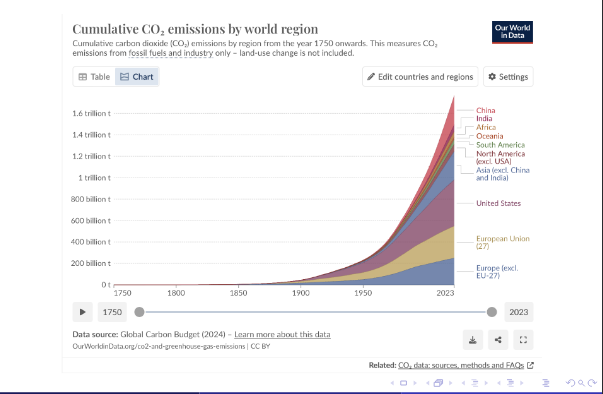
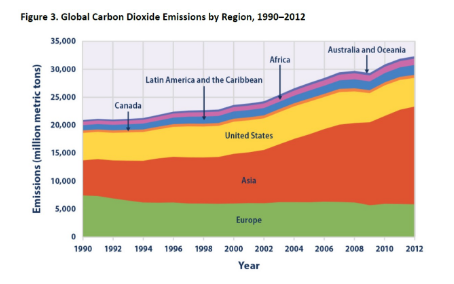
Stylised Fact 6: Most global emissions growth comes from developing countries
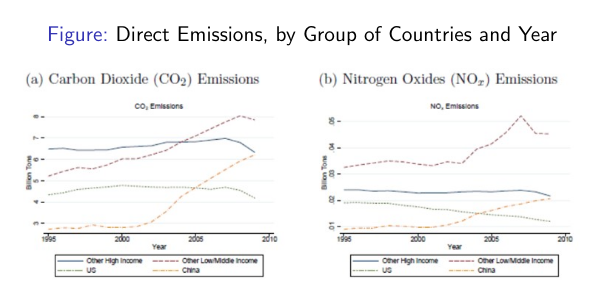 The sudden growth in C02 emissions coincides with China’s entry into the WTO.
- Data show that the most rapid environmental changes have occurred in low-to middle-income countries.
- These countries are the ones that have most recently joined the WTO, and as such they have experienced the most drastic tariffs reduction.
- It is likely that the exposure to international trade in these contexts has affected their emission intensity.
Stylised Fact 7: International trade accounts for a fourth to a third of global pollution emissions
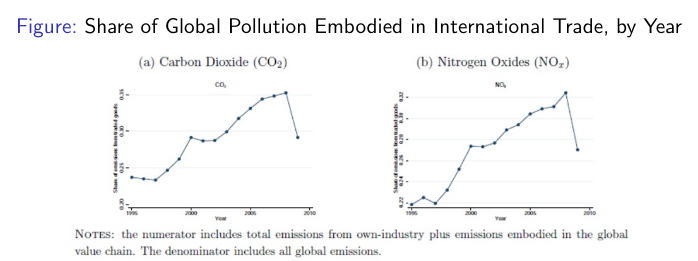 It’s not that trade is responsible for a third of emissions but that the products traded internationally by year are. In a world without trade we wouldn’t necessarily have less pollution. It could be that specialisation helps the environment, we don’t know for sure. It is likely that these goods would have been produced anyways…
- It is worth noting that these data do not indicate what the level of emissions would be in a counterfactual world under autarky.
- These graphs try to answer the question of how international trade affects the environment.
- The level of emissions in an autarkic world could be even higher.
- If goods were not imported, they could be produced domestically anyway, and thus leading to an ambiguous effect on the level of emissions.
- The data in the graph suggests that environmental policies applied to international trade can have great potential to reduce emissions.
Stylised Fact 8: Rich countries are increasingly outsourcing pollution
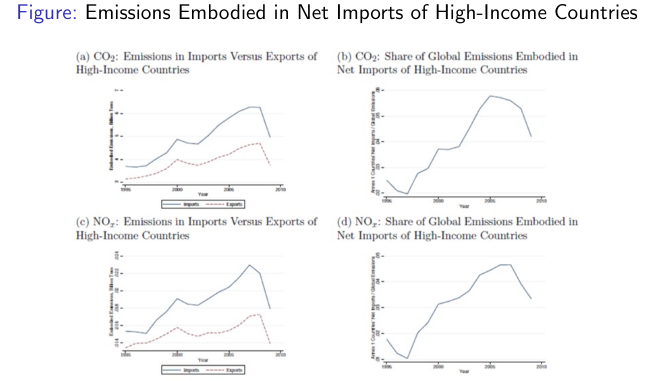
- The content of emissions contained in imports and exports of high-income countries is increasing over the period considered.
- The increasing gap between the two curves suggests a higher growth in emissions of imports than exports.
Stylised Fact 9: Technique accounts for a larger share of changes in emissions than composition
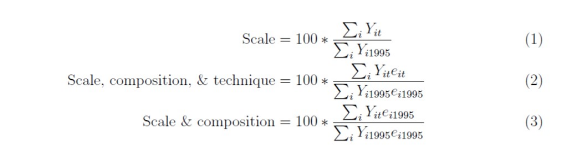
- With a simple exercise it is possible to calculate the difference in emissions due to scale, composition and technique effects for a sample of countries using the following parameters:
- ei t = emissions from sector i in year t (tons of pollution per dollar of value added).
- Yi t = added value (or production) of sector i in year t.
- The next slide show a figure where countries are listed in descending order according to their GDP growth in the year 2009, which actually represents the scale effect and is indicated with a blue dot:
- The red triangles represent the combined scale and composition effect, and show how emissions would have changed if emissions had remained the same as in the initial period considered, i.e. the year 1995.
- The distance between the blue dots and the red triangles indicates how the composition effect alone influenced emissions in the period considered.
- The red squares instead show the real change in emissions in the countries.
- The technique effect is equal to the distance between the red triangles and the green squares.
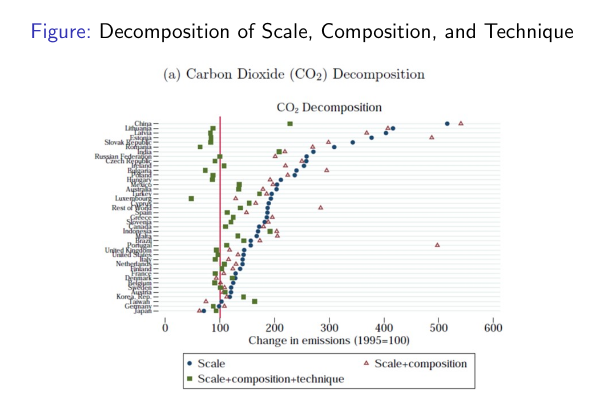
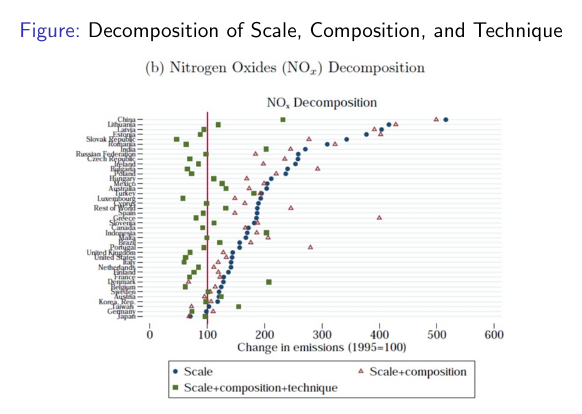
- The data in the graphs highlight some interesting aspects:
- The green square, an indicator of the overall effect, shows that emissions in China and India have doubled since the initial period.
- The most interesting aspect is that the technique effect is in almost all cases superior to the composition effect and in many cases superior to the scale effect.
- This can be due, for example, to a change in the energy source (e.g. from coal to gas), or to an increase in productivity or to more stringent environmental policies, or even to a reallocation of production towards more efficient companies.
- However, these conclusions must be taken with caution, as opening up to international trade entails other changes in countries that may have an impact on the environment.
- For example, an increase in per capita income due to trade opening could increase the demand for environmental quality in the country and consequently the creation of more stringent environmental policies by governments.
Trade openness and the environment
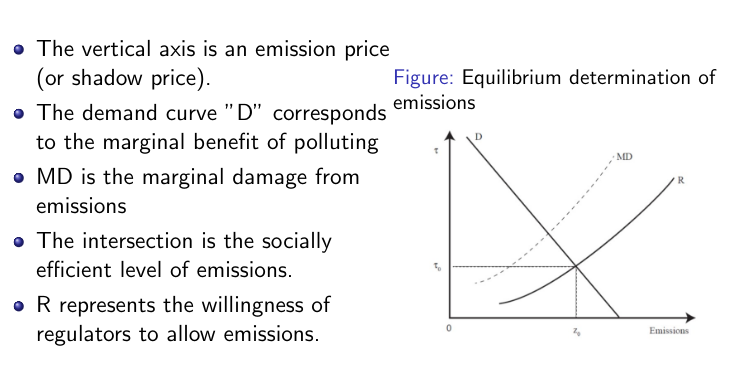
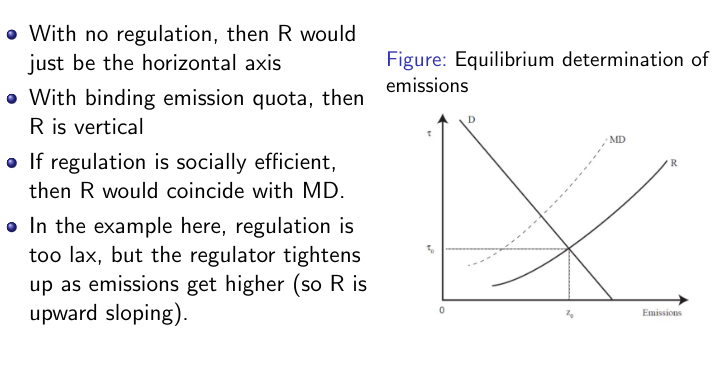
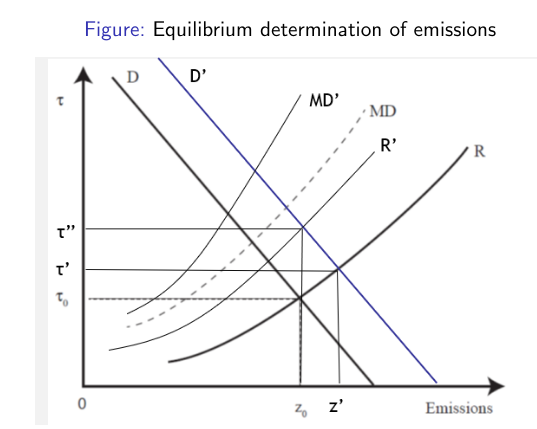 Openness to trade tends to increase real income, and any liberalization that does so has at least two effects:
- An increased scale of production will shift out the demand D for the right to pollute→this tends to increase pollution.
- If environmental quality is a normal good, the increase in per capita income will increase the demand for environmental quality so that MD shifts up to pollute. If regulators are responsive, the R curve will also shift up. This creates a technique effect (more stringent regulation) that tends to lower pollution.
- The net result on pollution is uncertain. If technique effects are very large, pollution will fall. Basically we can’t establish a standard effect of trade on pollution.
The pollution haven hypothesis
- If a country has a comparative advantage in pollution-intensive industries, then freer trade will shift the emission demand curve D to the right due to a composition effect.
- On average production becomes dirtier as the mix of production shifts to more polluting industries.
- Conversely, the trade-induced composition effect will shift D to the left for countries with a comparative advantage in relatively clean industries.
- The simplest version of the pollution haven hypothesis ties the direction of these shifts to the country’s level of environmental regulation.
- Countries with relatively weak regulation will attract dirty industries driving demand rightwards; the converse holds for those with strong environmental regulation.
- Copeland and Taylor (1994) developed a more sophisticated version.
What is the WTO?
- Global trade institution (since 1995) with 160+ members.
- Two core functions: rule-making (agreements to reduce obstacles to trade such as tariffs) and dispute settlement.
- Agreement family: GATT (goods), GATS (services), TRIPS (IP), plus plurilaterals and disciplines (e.g., TBT/SPS).
- Goal: a predictable, non-discriminatory trading system to facilitate exchange and growth.
Core WTO principles
- Most-Favoured Nation (MFN, GATT Art. I): treat all trading partners alike.
- National Treatment (NT, GATT Art. III): imported “like products” not treated less favourably than domestic.
- Transparency & due process: publish, notify, consult; fair administration.
The environmental space in WTO law
- Article XX allows countries to adopt their own laws in relation to environmental issues (has to prove it in an evidence-based way, this article arises suspicions).
- (b) measures “necessary to protect human, animal or plant life or health”.
- Like when covid.
- (g) measures “relating to the conservation of exhaustible natural resources”.
- Loss of biodiversity f.ex.
- (b) measures “necessary to protect human, animal or plant life or health”.
- These measures must be uniformly applied to domestic and foreign producers:
- TBT/SPS Agreements: disciplines on technical regulations, standards, and sanitary/phytosanitary measures-science-based, non-discriminatory, and not more trade-restrictive than necessary.
- When a trade policy is justified on the ground of environmental policy, this should be viewed as suspicious.
- A country’s environment should be protected by national environmental policies, and global environment by international environmental agreements.
- Restricting trade should be seen as a sub-optimal approach to environmental policy.
- Several examples of disputes at GATT and WTO on trade measured used by countries to protect the environment.
Example
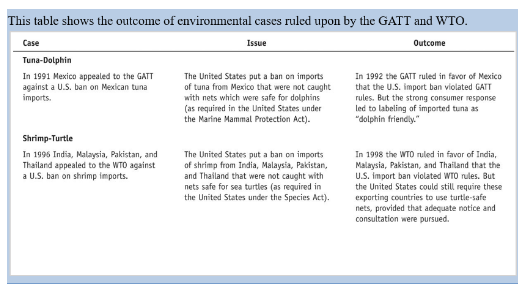
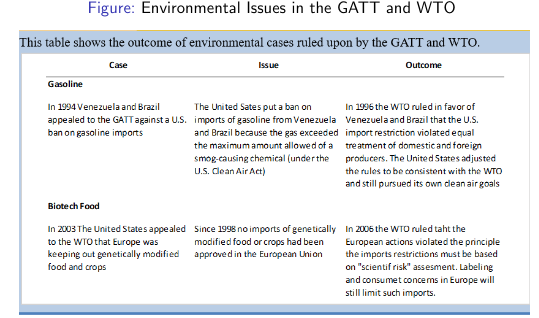
- Most of the time WTO rules in favour of free-trade, that is against the environmental argument. Mostly because of lack of transparency, clear objective and measures.
- Shrimp–Turtle & Tuna–Dolphin (snapshots): environmental goals can pass if measures are non-discriminatory, offer equivalent pathways to comply, and respect due process (notice, consultation).
- Key design lessons:
- Target the objective, not the origin; avoid de facto discrimination.
- Ensure flexibility/equivalence for different but comparable methods.
- Use transparent, evidence-based criteria and proportionate restrictions.
Debate on GATT and the environment
- The WTO has been often blamed to cause environmental degradation by promoting international trade.
- Fears of trade-driven degradation and weaker standards may be overstated.
- GATT/WTO allow market-based and command-and-control environmental measures.
- Countries can tackle production externalities for domestic and imported goods if measures are non-discriminatory.
- Basically all they want is for environment not to be used to protect domestic industries.
Bridge: from trade rules to climate cooperation
- WTO principles provide the design corridor for cross-border climate policy.
- Linking trade and climate (CBAM, standards, mutual recognition) can align incentives and curb free-riding.
- Next up: UNFCCC/Paris architecture, transparency, finance, and cooperation mechanisms (Article 6, climate clubs)..
Climate as a public good
- Climate is a global public good that is heavily affected by human activities, uniformly mixing pollution.
- No jurisdictional boundaries to enforce a policy restoring the optimal provision of that good.
- Free rider problems more relevant.
From Public Good to Global Momentum
- Climate = global public good: benefits are shared, emissions cross borders ⇒ strong free-riding incentives.
- Rising awareness & consensus: over time, worldwide recognition of environmental and climate risks has grown, building support for collective action.
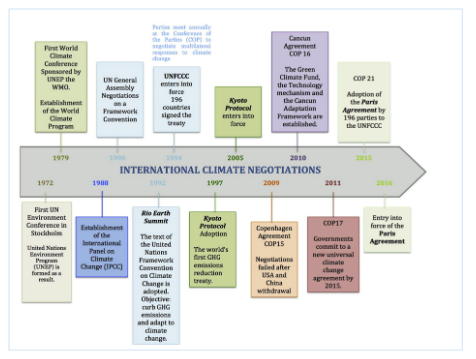
- Increasing awareness translated into institutions and milestones (UNEP → IPCC → UNFCCC → Kyoto → Paris) that structure the response.
- Message: growing consensus → denser rules → need for credible cooperation tools.
From awareness to commitment: why the environment matters
- From side issue to core pillar: since Stockholm 1972 (UNEP), via IPCC 1988 and UNFCCC 1992, environmental protection has moved to the center of global governance.
- From awareness to action: Kyoto (1997/2005) set targets; Cancún (2010) built finance/technology frameworks; Paris (2015/2016) achieved universal, iterative commitments (NDCs).
- Institutionalized commitment: annual COPs and the global stocktake embed continuous collective responsibility.
- Acknowledgment in practice: protecting the environment is now integral to health, prosperity, and international stability.
- The timeline charts a clear trajectory: growing recognition → deeper institutions → sustained, collective action to protect the environment.
From milestones to incentives
- Timeline’s lesson: participation broadened (Kyoto, Paris), but ambition/enforcement lag.
- Incentive problem: each country gains if others cut while it free-rides ⇒ Prisoner’s Dilemma payoffs dominate.
- So what next? Move from awareness to incentive-compatible designs (reciprocity, review, trade linkages).
Reminder on game theory analysis
- Recall that game theory is used to analyse choices where the outcome of a decision by one player depends on the decisions of the other players, and where decisions of others are not known in advance.
- This interdependence is evident in environmental problems.
- For example, where pollution spills over national boundaries, expenditures by any one country on pollution abatement will give benefits not only to the abating country but to others as well.
- Similarly, if a country chooses to spend nothing on pollution control, it can obtain benefits if others do so.
- So, in general, the pay-off to doing pollution control (or not doing it) depends not only on one’s own choice but also on the choices of others.
- We use game theory to investigate behaviour in the presence of global or regional public goods. The arguments also apply to externalities that spill over national boundaries.
Tragedy of the commons
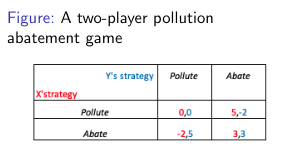
- Imagine, two producers of a dirty good have to decide whether or not to abate their emissions.
- Pollution abatement is assumed to be a public good so that abatement by either country benefits both.
- What should be the best strategy to preserve the environment? What should be the best strategy for the producers?
- Each unit of pollution abatement comes at a cost of 7 to the abater, but confers benefits of 5 to both countries. If both abate both experience benefits of 10.
- Non-cooperative game theory analysis leads us to the conclusion that the equilibrium solution to this game consists of both countries not abating pollution.
Characteristics of this solution
- The fact that neither country chooses to abate pollution implies that the state of the environment will be worse than it could be.
- The solution is also a Nash equilibrium.
- Neither country would benefit by deviating unilaterally from the outcome, and so would not unilaterally alter its strategy, given the opportunity to do so.
- The outcome is socially inefficient, so we are in presence of a tragedy of the commons (or free rider problem).
- Both countries could do better if they had chosen to abate (in which case the pay-off to each would be three rather than zero).
A cooperative solution
- Suppose that countries were to cooperate by negotiating a voluntary agreement (e.g. Paris Agreement, Kyoto Protocol).
- Would this alter the outcome of the game?
- Intuition would probably lead us to answer yes. If both countries agreed to abate – and did what they agreed to do – pay-offs to each would be 3 rather than 0.
- In a Prisoner’s Dilemma, cooperation offers the prospect of greater rewards for both countries, e.g. better environmental quality.
- But this tentative conclusion is not robust as the cooperative solution does not emerge spontaneously from parties’ negotiations and are typically unstable because the risk of free riding.
- Overall, Abate, Abate outcome is not a Nash equilibrium even in repeated games - social dilemma.
- Sustaining the cooperative solution:
- A voluntary agreement is not self-sustaining:
- Each country has an incentive to defect from the agreement, to unilaterally alter its strategy once the agreement has been reached.
- There is no external authority to impose a binding agreement and sanctions.
- A voluntary agreement is not self-sustaining:
Other forms of game: Chicken Game
- Not all games relevant for the environment have the structure of the Prisoner’s Dilemma (PD). Furthermore, there may be ways in which a PD game could be successfully transformed to a type of game that is conducive to cooperation. We now look at some other game structures.
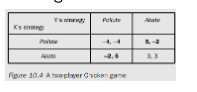
- A two-player Chicken game: No unique solution.
- The idea here is that ‘doing nothing’ has a high cost of -4, similar to what happens to climate change.
- But… . If the Chicken Game is played sequentially, then we can reach a unique solution.
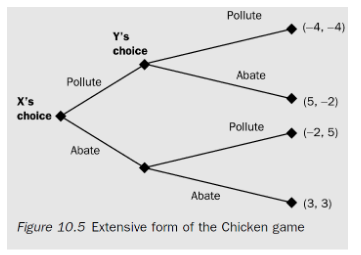
- Either way there is no stable solution that leads both of them to abate.
Leadership in the Chicken Game
- A strategy in which both countries abate pollution could be described as the collectively best solution to the Chicken game as specified in Figure 9.4; it maximises the sum of the two countries’ pay-offs.
- But that solution is not stable, because it is not a Nash equilibrium.
- Given the position in which both countries abate, each has an incentive to defect (provided the other does not).
- However, where the structure of pay-offs has the form of a Chicken game, we expect that some protective action will take place. Who will do it, and who will free-ride, depends on particular circumstances.
- Leadership by one nation (as by the USA in the case of CFC emissions reductions and the Montreal Protocol, EU for climate change ?) may be one vehicle through which this may happen.
The Kyoto Protocol
- The first major attempt to implement the treaty came with the Kyoto Protocol, signed in 1997:
- High-income countries agreed to reduce their emissions by an average of 20% by 2012 compared with 1990.
- However, the treaty did not work:
- The US never signed it, fearing to lose competitiveness with respect to China, which instead was considered a developing country, and thus free of any constraint in terms of emissions.
- Australia and Canada did not implement the treaty despite having signed it.
The politics of carbon dioxide mitigation
- The UNFCCC actually assigns the initial mitigation responsibilities to the high-income countries. However, since 1992 much has changed.
- China has now become the world’s second-largest economy and has actually become the world’s largest GHG emitter.
- China is now being called upon by countries around the world to take up more global leadership on climate mitigation.
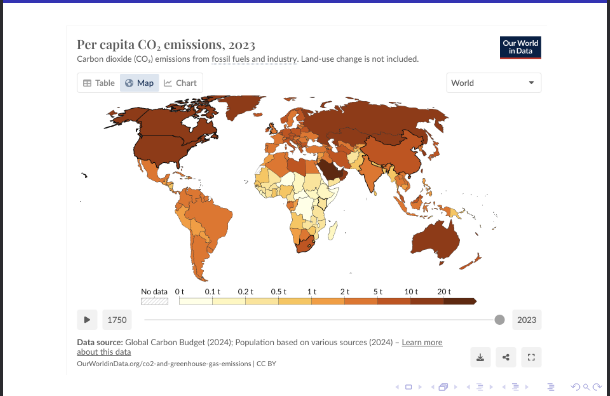
- China notes in its own defense that in per capita terms it still emits much less CO2 than does the US.
- There are internal pressures as well, as China itself is highly vulnerable to climate change.
- A significant part is very dry and it is likely to get drier in the future.
- China is highly vulnerable to extreme storms, extreme events and massive flooding.
- Heavy smog pollution is becoming more frequent in major Chinese cities,
- Some Chinese regions are estimated of losing around 5.5 years of life expectancy due to the heavy air pollution.
- This shows that global climate change fits well with the Prisoner’s Dilemma and public good game in which abatement inactivity is a dominant strategy.
- MAIN Negotiations concern public good benefits and no enforcement mechanism with sanctions for those who break the rules;
- Large number of affected countries (but emissions highly concentrated);
- Asymmetric costs and benefits by countries: for some countries (especially those specialized in carbon-intensive productions) nation-specific benefits are significantly smaller than transnational benefits.
- Priorities: economic growth for developing countries more important than environment.
- Fairness: who created the problem?
Optimists: Kyoto as a process
- Kyoto is a first step on the road to a more comprehensive and efficient IEA on climate change.
- It has generated a number of valuable institutional mechanisms and learning, and created political capital in support of cooperative actions.
Cumulative C02 emissions by country
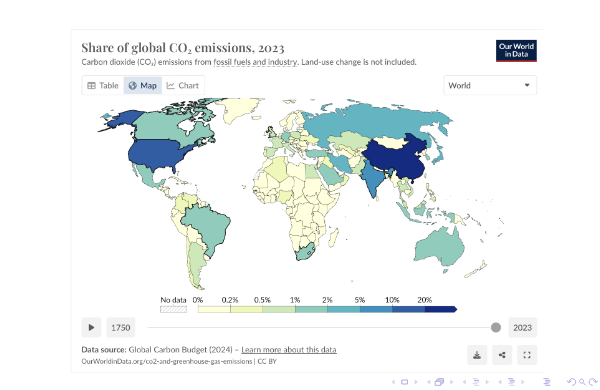
Share of C02 emissions by country
Per capita C02 emissions by country
Paris Agreement: what it is
- Adopted: 2015 (COP21), in force: 2016; nearly universal participation.
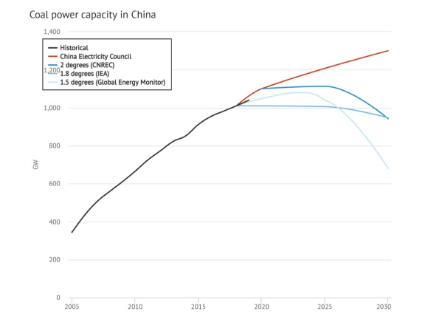
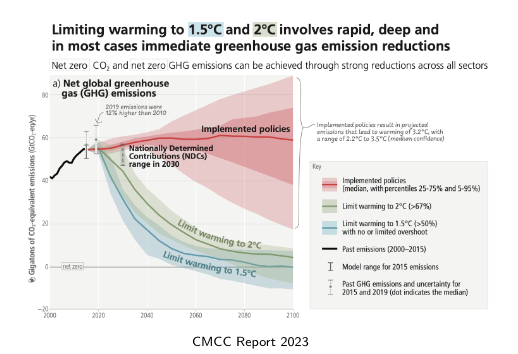
- Goals (Art. 2): hold warming well below 2°C and pursue efforts for 1.5°C; increase adaptation and align finance with low-GHG development.
- Architecture: bottom-up Nationally Determined Contributions (NDCs) with a five-year ambition cycle.
- No backsliding, progression expected.
- Transparency: standardised reporting + technical expert review + multilateral consideration.
- Differentiation: common but differentiated responsibilities (flexibility for capacity), universal participation.
Still unresolved problems with the Paris Agreement
- Again problem of voluntary agreement and thus lack of enforcement mechanisms and sanctions (next section of this lecture).
- Asymmetric incentives between developing and developed countries.
- Perceived risk of free riding high, especially in terms of competitiveness disadvantage.
- Officially, Trump leaves the Paris Agreement for coal miners.
Investments in coal power capacity in China expanded after Paris
Implemented vs. Limit warming policies
Why is deep climate cooperation so hard
- Effective mitigation of climate change will require deep international cooperation.
- Core diagnosis: decades of climate talk, little climate action.
- Actions to protect the climate involve the provision of global public good.
- Safe climate is advantageous to everyone but no party can be excluded from the benefits regardless their contribution ⇒ strong incentives to free-ride.
- Existing UNFCCC process (incl. Paris 2015) produced participation and talk, but limited impact on emissions so far.
Collaboration spectrum: coordination vs. cooperation
Collaboration is a comprehensive concept to describe international actions to achieve mutual goals can take many forms.
- Coordination = agreements are self-enforcing (low temptation to defect). (Example: if decided at the national level, USA drivers do not have incentives to drive on the left.
- Cooperation = not self-enforcing (high defection risk) ⇒ needs reciprocity, rewards/penalties. (Example: in the prisoner dilemma each player has incentive to confess).
Prospect for coordination and cooperation
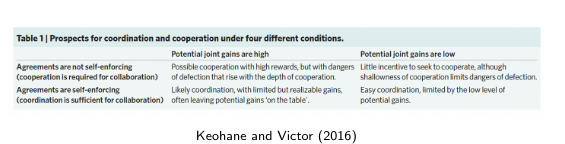
Table logic: prospects under four conditions
- High gains + not self-enforcing ⇒ big upside but fragile.
- Climate mitigation with large joint gains but high defection risk sits here.
- High gains + self-enforcing ⇒ likely coordination, but leaves gains on the table.
- From GATT’s easy, self-enforcing coordination (low defection incentives) to the WTO’s binding rules: diplomacy leveraged tariff-cut gains to move up the left quadrant.
- Much of the success with international trade follows this logic, thanks also to the support of the WTO.
- Low gains + self-enforcing ⇒ easy coordination (small, limited wins).
- Low gains + not self-enforcing ⇒ little motivation to engage.
- Policy implication:
- To move from shallow coordination to deeper cooperation, institutions must reduce defection incentives.
- The WTO’s success illustrates how reciprocity can stabilise cooperation when unilateral defection is tempting.
From hard cooperation to easier coordination
- Distinction between shallow coordination and hard cooperation helps explain why there has been massive talks on climate change but little progress.
- If the toughest problems are tackled first, deadlock is likely to result (f.ex. difficult to move forward after Kyoto failure).
- Diplomats often reframe problems to self-enforcing domains first (e.g., early trade rounds; Montreal’s start).
- Risk: if you stop at easy coordination, you capture only part of potential gains.
- Potential strategy:
- Start where agreement is feasible, then ratchet up using reciprocity-based mechanisms.
Domestic politics: interests that sustain collaboration
- Successful institutions create domestic constituencies that favor deeper integration (e.g., exporters in trade).
- Climate analog: design institutions that mobilise supportive interests (clean-tech industries, cities, civil society).
- Potential strategy:
- International bargains reverberate at home; aligning domestic winners is key to deeper cooperation.
What countries want: reading preferences via INDCs/NDCs
- Different factors affect countries willingness to pay to address climate change (e.g., population, technology, vulnerability to climate change, etc.).
- Paris process (INDCs → NDCs) reveals heterogeneous motives: global public good, local co-benefits, competitiveness, side-payments, reputation.
- Aggregate ambition is insufficient for 2°C path; current pledges reflect shallow coordination.
- Mapping motives helps target strategies that fit national interests and raise ambition over time.
Six strategy paths from shallow to deeper cooperation
Strategies that have been tried, from most comprehensive with highest impact (but difficult to implement):
- Universal binding targets/timetables (Kyoto-style): high ambition, high defection risk ⇒ deadlock/low participation.
- Climate clubs: smaller groups with excludable benefits/penalties; challenge: who pays for sanctions?
- Coordinated innovation: make clean energy cheaper than fossil to shift preferences (e.g., Montreal Protocol).
- Pledge & review (Paris): comprehensive but shallow unless review & linkage raise ambition.
- Coordinated national actions with local benefits (e.g., air quality, soot): good politics, limited spillover to deeper cooperation (e.g., China-USA 2014 agreement).
- Minimal universal deals (lowest common denominator): feasible yet modest effects.
Takeaway
- Deep mitigation sits where gains are high but defection is tempting.
- What to do: build rules that reward reciprocity and steadily raise ambition; tap different countries’ motives; and work through many linked institutions.
Ways forward to improve
Two ways ahead
- Complete change in perspective
- Focus on cooperation on R&D on new green technologies.
- Thanks to technological change, political acceptability will increase.
- Improve enforcement using trade restrictions to avoid free riding.
- In line with game theory, and the best solution for several famous economists (Nobel laureates: Stiglitz and Tirole, Will Nordhaus).
- Positive example of Montreal protocol.
- Subsidies to the green economy alone will not suffice: rebound effect.
Montreal Protocol
- Context: solve the problem of the Ozone layer depletion that aggravates global climate change.
- Solution: gradual ban of ozone-depleting gases with an international agreement, the so-called Montreal Protocol in 1989.
- Result of the agreement after 30 years: 4 times as much reduction of GHG than Kyoto, full participation, acceleration in the phasing out of GHGs such as chlorofluorocarbons (CFCs).
- Limits on both consumption and production: developed countries with higher willingness to pay for emission reductions consume, emerging countries produce.
- All countries involved, with differentiated responsibility. Emerging and developing countries compensated for their compliance costs.
- Broad participation reduces pollution leakage: should only some countries reduce emissions, comparative advantage in the carbon-intensive industries will shift to the other countries, causing their emissions to increase.
- Permanent agreement whereas Kyoto duration was limited.
- The main incentive, however, was a trade restriction. In particular, a trade ban on ozone-depleting substances and products.
Border carbon adjustments
- The issue for climate agreement can be set in terms of the so-called border carbon adjustments (BCA).
- That is: if two trade partners decide to have different carbon pricing policies, the country with the higher price can impose to the partner an additional tariff to level the playing field.
- This will prevent carbon leakage, i.e. the relocation of polluting industries in countries with laxer regulations leading to an unintended increase in CO2 emissions.
- Practically, BCA can include three types of measures: (i) border taxes proportional to the difference in the carbon taxes; (ii) mandatory emissions allowance purchase by importers; and (iii) embedded carbon product standards.
Main problem
- A lot of information is needed to estimate the carbon content of a product, especially given the fact that the value chains are global and highly fragmented.
- Risk of retaliation if WTO rules are not changed.
Climate clubs
- William Nordhaus (2015): start with a coalition or club of countries implementing an ambitious carbon tax and use external sanctions to induce the uncooperative parties/non-members to join.
- External sanctions are penalty tariffs uniform on all products of nonparticipants, not only on polluting ones (i.e. solve the problem of measuring the carbon content of products).
- Key assumption: non-participants cannot retaliate because the WTO embodies this principle in his rule.
This solution is very appealing for four reasons
- Easy to implement, as long as there is an initial coalition large enough that joins (EU+China?).
- The costs of non-joining can be significantly higher than the benefits from free-riding; it provides an incentive to increase the size of the club.
- Nordhaus carries out simulations to show that a 2% tariffs is enough to induce largest countries to join the clubs.
- It prevents carbon leakage without using too much information as for the border carbon adjustments.
- Game-theoretic robust: the equilibrium is stable in every period like a Nash-equilibrium in the PD game.
- Both carbon border adjustment and uniform penalty tariffs in the climate club proposal require climate amendments to international-trade law, both internationally and domestically. The climate amendments would explicitly allow uniform tariffs on nonparticipants within the confines of a climate treaty; it would also prohibit retaliation against countries who invoke the mechanism. Requiring such amendments would emphasise that climate change is an especially grave threat, and that this approach should not be used for every worthy initiative. (Nordhaus 2015).
- Current international trade laws, i.e. the WTO, are very far from recognising this special status to climate change.
- So the possibility that the WTO will accept that only the members can impose a sanction without retaliation of the others is remote.
- Key priority: gain political support to reform the WTO in this direction.
Other practical solutions
- While a ban on products that emit CO2 is impossible to implement as every product emits CO2, a coal ban, the most polluting fossil-fuel source, can be a solution especially with compensation for coal producers.
- Another solution, suggested by Barrett (2008), is to focus on sectoral agreements on, for instance, aluminum and forests’ preservation.
Fact: few countries contribute to the Bulk of GHG emissions
Easy agreement
- No! As these few countries have no the same incentives to engage in climate change mitigation.
- There are several sources of asymmetry between developing and developed countries.
- Ethical issues: developing countries claim that climate change problems have been created by developed ones, so rich countries should bear the burden of climate change mitigation (ethical problem).
- Preference issues: developed countries care more about environmental quality than developing ones as they have already meet other development goals. This is a legitimate reasons why these countries wish to set different environmental standards (recall EKC).
- International competition: developing countries can gain or have a comparative advantage in trading pollution intensive goods and attracting multinational companies that want to escape stringent environmental regulation in developed countries.