Environmental economics
General introduction
What is environmental economics
- Environmental economics is a branch of economics that examines how and why economic activities may generate environmental problems (such as air and water pollution, toxic waste, and climate change).
- Devises policies to manage them.
- How to value environmental goods and services and seeks to correct market failures like externalities.
- Natural-resource economics extends this focus to the efficient and sustainable use of resources, covering both renewable systems (e.g. water, forests, fisheries) and the optimal extraction of finite resources like energy and minerals.
The economy and the environment
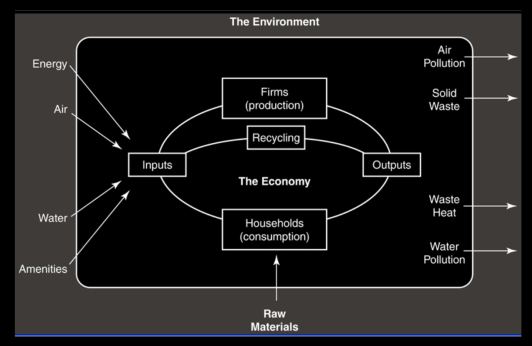
- The environment provides 4 functions to the economy:
- Source of resource inputs (inputs in drawing below).
- Without plants we dont have medicine (f.e.).
- Provides life support services.
- Receptacle for wastes.
- Source of amenity services.
- Hikes f.e., pleasurable activities basically. If you care about them, the utility of the environment will go up for you.
- Source of resource inputs (inputs in drawing below).
- These environmental functions interact with one another in various ways, and may be mutually exclusive (you may not be able to use them for 2 functions or more at the same time).
- As with other assets, we wish to enhance, or at least prevent undue depreciation of, the value of this asset.
The economy system and the environment
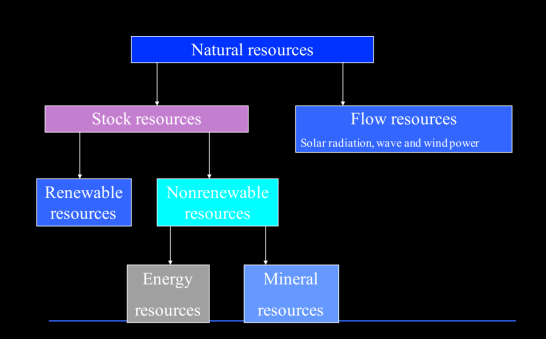
Classification of natural resources
 The way we use stock resources will impact us in the future, specially for those that are non-renewable (finite). Renewable ones grow until reaching caring-capacity (how much individuals of a population the environment can sustain).
- Natural resources used in production are of several types.
- One characteristic: the resource exists as a stock or a flow?
- Difference: does the level of current use affect future availability?
- Flow resources: no link.
- Stock resources: yes, it does.
Stock resources
- Renewable resources are biotic populations – flora and fauna: have the potential to grow by natural reproduction.
- Non-renewable resources are minerals, including fossil fuels: no natural reproduction, except on geological timescales.
Issues for renewable resources
- Services provided by the environment are essential for our prosperity.
- Biodiversity such as insect pollinators or forests provides essential economic value.
- The passive economic value of the environment as input of our well-being and prosperity is often not considered when making economic choices.
- This is because biodiversity is not priced on the market →missing market.
Issues for non-renewable resources
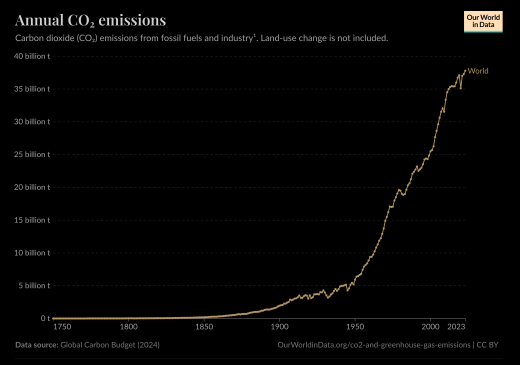
- Fossil fuel combustion is the major source of GHG emissions, e.g. CO2, which causes global warming.
- CO2 is by far (80%) the most important GHG driving climate change, raising temperatures, and creating disastrous socioeconomic damages.
- Who pays for this social cost?
- What is the economic problem behind it? Missing market for the climate, in general, we cannot buy lower temperatures.
Waste
- Many of the activities involved in production and consumption give rise to waste products.
- According to the material balance principle, waste products are the necessary counterpart of the use of natural resource input in production.
- Consequences of waste discharge into the environment can be very harmful to human beings:
- Illegal landfills; Plastic in the Ocean; Chemicals released in rivers.
Regulating waste disposal
- Environmental economists study the best way to regulate waste discharges and limit the harmful consequences for humans in terms of health and loss of other environmental services, i.e. collapse of the fish population, loss of amenity services etc.
- Idea: build a circular economy where waste becomes a productive asset that can be recycled, reused, repaired and reduced.
- Non-recycled waste has a social cost: burning them pollutes, putting them in a landfill may also pollute the aquifer, etc.
Amenity services
- The biosphere provides humans with recreational facilities and other sources of pleasure and stimulation.
- The role of the natural environment regarding amenity services can be appreciated by imagining its absence.
- When somebody destroys a national park or a forest, this has a social cost because the local community cannot anymore enjoy them.
- Who pays for avoiding the destruction of amenity services? Missing market for amenity services, i.e. in general, we cannot buy a river or a mountain.
Basic life-support functions
- The biosphere currently provides the basic life-support functions for humans.
- The range of environmental conditions that humans are biologically equipped to cope with is greater than for most other species, but with limits.
- Specific requirements in terms of breathable air.
- Range of temperatures.
- Minimum requirements for water input.
- Who pays for avoiding the destruction of life-support services?
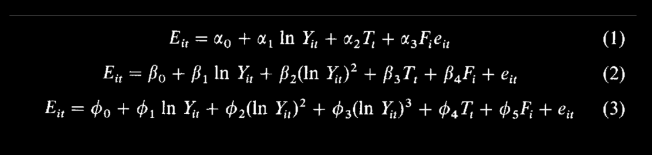
The production function
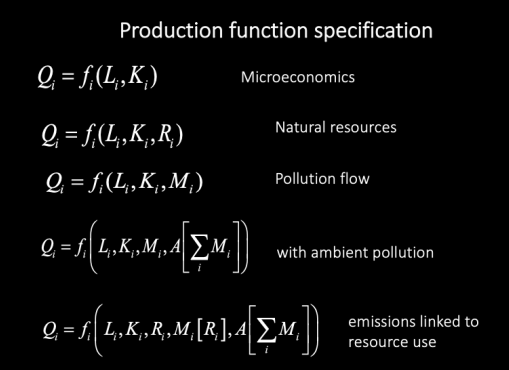
- Output according to labor and capital.
- Adds natural resources as a factor of production.
- Includes pollution as byproduct.
- Includes ambient pollution (total pollution by all producers).
- Here M (pollution) is linked to how much R is used (resources).
This proves that in economics it is not that difficult to handle environmental factors, adding them into our production functions. The problem is measuring them, they are not like capital.
Does Economic growth harm the environment?
- The World Bank’s World Development Report 1992 (IBRD 1992) was subtitled Development and the Environment.
- Affluence and the environment.
- The view that greater economic activity inevitably hurts the environment is based on static assumptions about technology, tastes and environmental investments.
- Assuming that consuming more→happier. And if that this entails using resources K and R (producing M), then people will want growth which comes at the expense of the environment.
But is this really true?
Maybe this assumptions could change, technology or mentality among others.
Empirical analysis
- Relation between growth and environmental degradation. Linear positive correlation.
- Same as 1. but as a bell. So after a certain e.d. point the growth makes us be greener and cleaner.
- Like 2., but in the end e.d. goes up after a while. ==N shaped==.
The t shows that these analysis are not cross-sectional, not snapshots. What they are is a look at the same factor on a country across a given period of time.
Grossman and Krueger
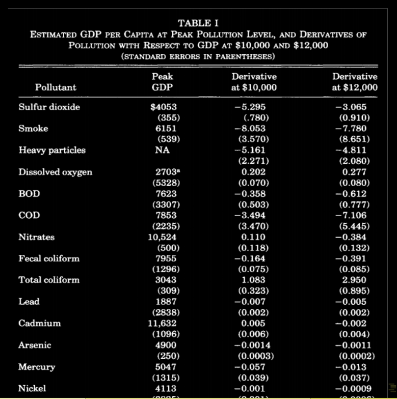 They did and study and found that→
Environmental Kuznets Curve
Richer→cleaner.
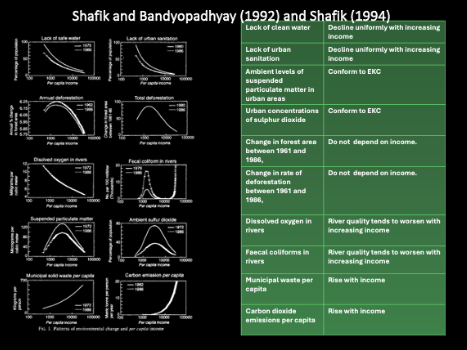
- Grossman and Krueger (1995): the inverted ‘U-shaped’ pattern in the EKC hypothesis arises as a result of the joint effects of the scale of the economy, its composition and technology.
- in the end the best - and probably the only - way to attain a decent environment in most countries is to become rich. Beckerman (1992).
Why it is not completely true
- Outsourcing (pollution haven).
- Change of measurement techniques with time and modernisation.
- Change of preference that comes with economic growth rather than economic growth.
- Some go up. Not all indicators have the same value as well.
- Doesn’t work that well for global pollutants compared to local ones.
- Even if this is 100% true, are we willing to assume the cost of getting to the maximum pollution of a very toxic pollutant just to get to the downwards part of the ekc?
- The EKC relationship has been shown to apply to a selected set of pollutants only, but that some economists have conjectured that the curve applies to environmental quality generally.
We conclude that
- Economic growth is not a panacea for environmental quality.
- Policies that promote gross national product growth are not substitutes for environmental policy.
Forces that may explain an EKC path
- Structural changes: pollution declines as incomes grow because of the changes in the product mix or technology.
- Trade: when incomes increase, countries increase their imports of pollution-intensive goods, in essence exporting pollution.
- Luxury good: as incomes grow, households choose more environmental quality and the various production and consumption processes comply through public action: Income elasticity to environmental quality.
- Regulation: Race to the bottom. Polluting activities do move around (Henderson, 1996; Greenstone, 1998; Becker and Henderson, 2000, List et al 2003).
EKC: The case of C02 (more rich more C02 for now)
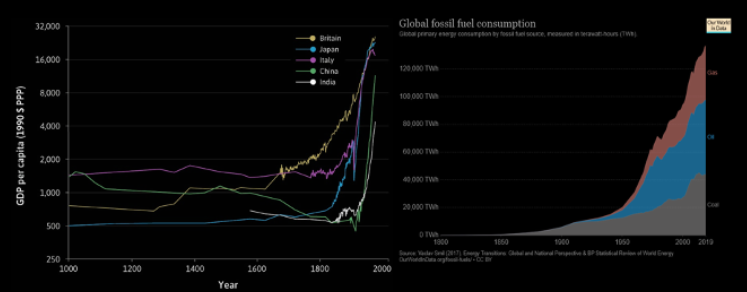 C02 is not as regulated because it is not easily immediately noticed by people. S02 can be smelled and sensed, f.e.
Alix-Garcia et al. (2013) Causal evidence from Mexico Oportunidades program
- In order for correlation to be causation it has to be known that it has to be the variance of income that changes e.d. and not just that they happen to move together. This can’t be extrapolated from current studies.
- Oportunidades exogenous income shock.
- 40 per cent of rural households increased their income by 1/3.
- They have to send their children to school.
- Regression discontinuity.
- At least in the short term (the study did not cover the program for its entirety of 20 years) deforestation actually increased. People could buy more and so they did. To raise stuff as beef you gotta cut down trees (f.e.), and consumption had increased. They could buy from other villages, did not have to be necessarily from theirs. Those villages closer to transports suffered this the most.